OCULOMOTOR CORRELATES OF BEAUTYY
Beauty is no quality in things themselves: It exists merely in the mind which contemplates them; and each mind perceives a different beauty (Hume, 1739/2012)
What does it mean if something is beautiful?
From the beginning, the development of techniques of coding meanings into the framework of images has been accompanied by aesthetic needs. Regardless of whether or not we are aware of it, we evaluate the objects we observe by categorising them into those which we like and enjoy, or even desire, and those which we reject as valueless and unsightly. Evaluation of objects does not exclusively refer to works of art, even though most people are convinced that this category of objects is particularly subject to aesthetic assessment.
It is paintings, sculptures, architecture or decor that are most often evaluated as beautiful or ugly. The idea that we apply this category to objects of everyday use less frequently is but an illusion. As Ernst Gombrich (2005) points out, the essence of aesthetic experience is by no means based on any definition of what is or should be treated as Art, especially when written with a capital “A”, but rather on the feeling that something simply looks “good”, regardless of whether it hangs on a museum wall or serves as a dress accessory.
A similar view is presented by Jean-Marie Schaeffer (1999; 2000), emphasising the subject’s decisive role in determining the aesthetic value of an object. Similarly to perceiving a color or shape, the impression of communing with a beautiful object is a subjective experience rather than an innate trait of that object (Gołębiowska, 2005). Such a conceptualisation of aesthetic experience opens up an aesthetics research field for a psychologist who requires operating categories that are semantically much simpler than those proposed by aesthetics-related theories built at the interface of philosophy, anthropology and art history.
The intuition that something looks good, better, or worse, is spontaneously verbalised by means of expressions: “I like it,” “I don’t like it,” “I like it more” or “less”. It is of significant importance for psychologist interested in researching aesthetic phenomena because these expressions constitute useful behavioural indicators of the peculiar state of mind that we commonly refer to as aesthetic judgement or, in Kant’s terms, judgement of taste (Kant, 1790/2004). Recognising something as pretty or good – within the meaning assigned to this word by Ernst Gombrich (2005) – constitutes a convenient starting point to search for the determinants of classifying an object based on its aesthetic values.
The need for aesthetic evaluation and communion with beauty is also an emanation of biologically determined adaptation mechanisms that allow one to survive in a complex, often intimidating reality. It is a manifestation of the Freudian life drive (Eros) as a counter-balance to the destructive death drive (Tanatos) as the concept of being visually “pretty” stands for numerous categories which refer to various sensual modalities, such as “good”, “tasty”, “safe”, “soothing”, “relaxing”, “nice”, “seductive” or “cheerful”. All of these concepts hold a definitely positive connotation. They signify states of mind that we particularly require to live, and therefore they must undoubtedly have a solid neurobiological basis.
What is the nature of these subtle mechanisms of experience and aesthetic evaluation of perceived images? What behavioural (cognitive, emotional or motivational) dimensions can be used to describe them? Can they be captured by means of neurophysiological (oculomotor, encephalographic, electromyographic) indicators and neuroimaging? When it comes to contemporary empirical sciences, including especially cognitive psychology, neurobiology and neurophysiology, these questions have only begun to be posed. Most of them are not yet fully-developed decisive questions that lie at the bases of scientific hypotheses. They are rather exploratory in nature, testing the intuitions derived from more or less speculative theories from the fields of aesthetics, anthropology, history of art and philosophy.
Experience and aesthetic judgement
One of the most important, subjective factors conditioning an aesthetic judgment is aesthetic experience. It is a reaction to the object of pre-reflective and emotional perception, which precedes the reflective aesthetic judgment. According to Jean-Marie Schaeffer (2000), an aesthetic judgment is an expression of reconciliation of value with the subject of aesthetic experience.
Although the distinction between aesthetic reactions to: survival and judgment and the chronological order of these reactions (first survival and then judgment) are accepted by many aesthetic theorists (Gołaszewska, 1984; Tatarkiewicz, 2009), in research conducted on the basis of psychology or neuro-aesthetics they are rarely taken into account (Vartanian and Goel, 2004a). In the vast majority of psychological experiments, the task of their participants is to assess the aesthetic reproduction of works of art that are presented on a computer monitor for a limited time. Such a procedure is more like testing the perceptiveness of driving license students than contemplating works of art at the museum. The basic condition for an aesthetic experience is the free time used for contact with the work.
Oculomotor indicators of mental processes
The purpose of research conducted in our laboratory is, among others, searching for oculomotor correlates of experience and aesthetic judgment. Eye movement registration seems to be an attractive tool for examining aesthetic preferences because it provides objective indicators of the strategy of viewing of objects being evaluated. After all, with our eyes closed, we cannot make an aesthetic evaluation of the image we have never seen. In turn, with eyes open, we move them, focusing the visual axes on various fragments of the viewed work and on this basis we evaluate it.
Underlying the oculomotor examination is the assumption that the viewer most often looks at those parts of the image that he or she thinks about or which are of particular importance to him/her. Also, the time spent on viewing of these fragments is an important indicator of the interest and depth of processing of sensory data collected during visual fixation. Generally speaking, eye movement trajectory parameters are interpreted as indicators of mental processes whose purpose is to integrate information about the seen scene, as well as its evaluation (Massaro, Savazzi, Di Dio, Freedberg et al., 2012; Poole and Ball, 2005).
Presenting in this chapter the results of the experiment on beauty perception, I focused on analysing data concerning the time, number, places of visual fixation on the paintings (and their fragments) presented to the subjects, length and speed of saccades, as well as the frequency of saccades returning to places previously viewed, i.e. the so-called regression. These indicators are divided into two main groups: fixations and saccades.
Fixations
Fixations can be described by three parameters: time, number and frequency. The fixation time is divided into fixation duration total and fixation duration average.
Fixation duration total is about 90% of the total (global) image viewing time, so it is most often interpreted as a general indicator of interest in it or an indicator of difficulty in obtaining unambiguous perceptual information about it (Hauland, 2003; Latimer, 1988; Mello-Thoms, Nodine and Kundel, 2002). Fixation duration total can refer to both the entire image space and its fragment. If it refers to a small part of an image then it is referred to as a gaze. Gaze is the most commonly used indicator of visual attention, presented graphically on attentional maps or, in other words, heat maps (Hoffman, Grimes, Shon and Rao, 2007; Stellmach, Nacke and Dachselt, 2011). These are the multi-colored spots applied to the viewed image. I have used this way of presenting data many times, illustrating some of the effects discussed in this book.
In turn, the average fixation time, which is the quotient of the fixation duration total by their number, is an indicator of the increased involvement of visual attention in the accurate exploration and interpretation of the image or its fragment, as well as the depth of sensory data processing (Buswell, 1935; Duchowski, 2007; Goldberg and Kotval, 1999; Just and Carpenter, 1976). Shorter average fixation times are associated with more complex, more detailed images compared to less complex, less lighted or blurred images (Duchowski, 2007; Molnar, 1981).
An interesting indicator of image exploration is also the time after which the viewer first looks at the area, which for some reason is interesting for the researcher. It is the so-called time to first fixation on target. The area where the observer’s gaze is directed the fastest from the moment the exposure begins, most likely meets the criteria for the task of viewing it. This eye movement is a manifestation of involuntary attention (Byrne, Anderson, Douglass and Matessa, 1999).
The fixation count, like the fixation duration total, is a general indicator of interest in an image. There is a high correlation between these two indicators: the more fixation points are, the longer their duration total is. The fixation count is an important indicator of viewing a painting, especially when we focus not so much on its entire surface but on its various parts.
Greater cluster of fixations on a small area of a painting, the so-called area of interest (AOI) can mean either an increase in difficulty in recognizing the objects depicted on it (Jacob and Karn, 2003), or the special importance of this area for capturing the sense of the entire scene depicted (Poole , Ball and Phillips, 2004). The smaller the area of interest determined by the fixation count and cluster of fixations, the more inquisitive and targeted the search of this field is. On the contrary, the more diffused the fixation points located in a small area, the less focused its viewing (Cowen, Ball and Delin, 2002).
The opposite of the fixation duration average is the fixation frequency. It is the quotient of the fixation count (in relation to the whole painting or selected areas of interest) by their duration total. A higher fixation frequency means a greater count of analysed fixation points per unit of time, e.g. per second. It can be an indicator of emotional arousal resulting from performing a task under time pressure or a strong need to identify difficult to recognize things in the part of the picture being viewed.
Saccades
The second group of eye trajectory parameters refers to saccades, i.e. shifts in the visual axis from one position to another. Saccade duration total is about 10% of the total image viewing time, while the saccade count is equal to the count of fixation points minus 1. Sometimes statistical analyses use the saccade duration average, i.e. the quotient of the saccade duration total to their count.
The duration of individual saccades is an order of magnitude shorter than the fixation duration and generally do not differ significantly from each other. However, if there are any differences found between them, they most often result from the distance that divides the next two points that intersect the visual axis. It is the distance between successive fixation points that is the most important characteristic of the saccade. It is called the saccade amplitude and most often the saccade amplitude average is analysed. This is a scanpath strategy.
Wolfgang H. Zangemeister, Keith R. Sherman and Lawrence Stark (1995) registered the eyeball movement of art experts and laypeople while viewing realistic and abstract images. They divided the saccades into global (longer than 1.6°) and local (shorter than 1.6°). It turned out that experts were much more likely to use global image searching strategies, while laymen were more likely to use local strategies.
Both visual scene search strategies (global and local) can be motivated in a “bottom-up” or “top-down” manner (Massaro, Savazzi, Di Dio, Freedberg, et. al., 2012). The bottom-up strategy of the perceptual field search is based on structural features of the image such as contrast, color or composition. They attract the observer’s eye and focus his or her attention. Laurent Itti and Christof Koch (2001) proved that “bottom — up” visual salience of various image elements can significantly contribute to forming the scanpath, namely the total length of all saccades (scanpath length), and, thereby, indirectly influence their amplitude. In addition, bottom-up motivated strategies are more characteristic of the novices in the field the visual scene concerns than of the experts (Humprey and Underwood, 2009).
On the other head the top-down strategy of searching the field of perception is to a greater extent controlled by knowledge and the attitude of the observer towards image exploration, resulting form some question or aimed at verifying a hypothesis. Top-down strategies are more often applied by experts in the field the image pertains to than by novices (Humprey and Underwood, 2009).
For the purposes of oculographic data analyses the frequency of the so-called regressive saccades or, shorter, regressions, is taken into consideration. Regressions are expressed by multiple relocation of the visual axes onto a previously observed element of a visual scene (Sibert, Gokturk and Lavine, 2000). Their frequency indicates the need for repeated exploration of the area. The reason for the regression are most often difficulties with reading the sense of the image contained in the element, due to its visual ambiguity.
Regression are especially observed while the examined people are performing tasks which require sequential relocation of vision in one direction, for example while reading. People who read poorly have a lot more regressive saccades than people who read very well (Rayner, 1975; Rayner and Pollatsek, 1989; Rayner, Slattery and Belanger, 2010).
Research questions
After this brief discussion of the parameters of eyeball movements, I wish to present the results of one of the tests conducted in our laboratory. Its aim was to determine whether and what are the differences between the oculomotor indicators when viewing images classified by the subjects as beautiful and as non-beautiful (this does not mean ugly, but not belonging to the category of beautiful images). To a large extent, these studies were exploratory in nature because no oculographic experiments had been conducted so far, in which the analysis of aesthetic preferences was performed taking into account the division into experience and aesthetic judgement.
The motivation to undertake this study was also the search for an answer to the question whether the oculomotor activity accompanying the aesthetic experience (operationally defined as free viewing of images) differs from the oculomotor activity when making aesthetic judgments.
A few words on the method
The experiment referred to in the next chapter was conducted in an acoustically isolated studio in the Psychoneurophysiological Laboratory by the Department of Experimental Psychology of the Lublin Catholic University. SMI iView X Hi Speed oculograph with 1250 Hz sampling frequency, 0.5 millisecond latency and 0.01° resolution was used to measure eyeball movement. The stimuli were displayed on a 23″ Apple Cinema HD Display screen (1920x1200 pixels) at a distance of 60 centimetres from the eyes of the subjects (which corresponds to a 28.65 view angle). The subjects provided their responses using an Ergodex DX1 keyboard with various button layouts.
The procedures for displaying stimuli and recording oculomotor and behavioural data were written by Paweł Augustynowicz in E‑Prime v. 2.0. I carried out the analysis of behavioural and oculographic data with OGAMA v. 4.0, BeGaze (for iView X SMI) and the STATISTICA v. 9.0 software package, mainly using variance analysis. The laboratory experiments were supervised by Bibianna Bałaj. The research was anonymous, and those who participated did not receive any additional compensation.
The experiment consisted of two consecutive parts. In the first one, the examined persons were asked to see a set of several dozen portraits from the collection of the Museum Palace at Wilanów. The paintings were exhibited in a random order, determined individually for each respondent. The time during which the paintings could be viewed was unlimited. The respondent could look at each piece of art as long as they wanted. To view the next painting, they pressed the respective key on the keyboard.
In order to standardise the research situation, before the first part of the experiment, the respondents were instructed to look at the paintings in such a way that, after seeing the entire collection, they could point to those they considered to be particularly beautiful. According to the instructions, the examined persons learned that the Museum Palace at Wilanów is preparing for an international conference devoted to the most beautiful portraits from its own collection. According to the concept of the organisers, the conference is to be accompanied by an exhibition of paintings selected on the basis of the highest aesthetic values. Not only art historians and museum workers, but also a wide range of art viewers were asked to point to these paintings. The aim of this study is to select 8–10 most beautiful pieces of art from the collection.
The unlimited time to view the paintings during the first part of the experiment and the instruction to look at the paintings in terms of their aesthetic values created an opportunity for the respondents to spontaneously enjoy an aesthetic experience. Not only did they not have to perform tasks under time pressure, but what is more, they were convinced of the high value of their own evaluation, regardless of any social norms, beliefs or trends that might influence them.
In the second part of the experiment, the paintings that had already been viewed were presented again in random order. This time the respondents were asked to decide whether they would place the painting on the list of the most beautiful ones or not. They signalled their decision by pressing the appropriate key on the keyboard. In this part, they directly expressed their assessment of the piece of art in terms of aesthetics. As in the previous stage, we did not limit the time spent on viewing the painting in this phase. During both parts of all the experiments, we recorded the eyeballs movement, reaction time and decisions of the examined persons with regard to all the paintings being presented.
PORTRAITS FROM WILANÓW
Why portraits?
Portrait is one of the oldest forms of depicting people in paintings or in a form of sculptures (Freedberg, 2005; Sufi, 2001). In perceptual terms, representation of a human being in a picture, especially his or her face, has a similar status as watching it “live”. The human face is perhaps the strongest visual stimulus that focuses attention on itself to an incomparably greater degree than any other element of the visual scene. This phenomena was described by Guy Thomas Buswell in the 1930s, when he presented the results of oculography studies in his classical work: How people look at pictures (1935). The aim of his research was to discover the regularities governing the eyeball movements when looking at pictures of different content. He called faces on the paintings as the principal centres of interest.
The results of Buswell’s pioneering analyses were later repeatedly confirmed in studies in which pictures depicting human faces were used as stimulus material (Land, Tatler, 2009; Yarbus, 1967). The result was always the same. Regardless of whether the portrayed persons were pretty or ugly, regardless of painting technique used to illustrate them, they always focused the audience attention first an to a greatest level, compared with all the other elements of the presented scene.
Thus, asking the question concerning how people look at pictures containing the images of people, the fact whether their faces are pretty or ugly was not my concern. First of all, I wanted to know whether during looking at pictures that are considered to be beautiful as a whole, the examined persons move their eyes in the same way as when looking at pictures that are rated significantly lower in terms of their aesthetic value. Of course I haven’t failed to check if the faces in the pictures that were evaluated as beautiful are looked at in the same way as the faces in the pictures regarded as non-beautiful. It turned out that yes indeed, regardless of the fact whether faces are beautiful or not — people devote equally much attention to portrayed faces.
Oshin Vartarian and Vinod Goel (2004b) found significant correlation between the time of viewing pictures and aesthetic preference. People look longer at images which are more beautiful. It is confirmed also by the results of other studies (Hauland, 2003; Latimer, 1988; Mello-Thoms, Nodine and Kundel, 2002). Therefore, if the time devoted to looking at faces is similar regardless of whether they are ugly or pretty, to what else do they devote time while looking at pictures, which they claim are beautiful? In these studies, the issue that interested me the most was the search for oculomotor correlates between the aesthetic experience and the aesthetic judgement crowning it, while looking at whole pictures, an element of which were faces of portrayed people.
Stimuli from the Wilanów collection and the research subjects
The Museum Palace at Wilanów gathers collections of works of art related to place and persons who have shaped its image for more than three hundred years. Portraits constitute a larger part of the collection and they were also chosen as the stimuli in these studies. Upon my request to the administration of the Museum I was given a set of over 50 high-resolution painting reproductions, which were selected by the art historians working in the museum as the most valuable. These paintings were created in the 16th, 17th and 18th century, and all of them depicted at least one person.
After discarding a dozen or so paintings for technical reasons or due to the fact that they depicted famous people, for example king John III Sobieski, I finally decided to use 32 reproductions. These paintings were placed on grey boards and evened out on the basis of their height, regardless of their actual dimensions (Fig. 162 A and B).
24 people (14 women and 10 men) aged 17 to 30 years (M = 24, SD = 4.19) with correct visual acuity or the visual acuity corrected to normal were invited to participate in the study. None of them practiced visual arts or had any education in art or art history. Their interest in painting could be described as typical in relation to most museum visitors.
Beautiful and non-beautiful portraits
In accordance with the procedure described in the introduction to this chapter, at the second stage of this experiment the subjects chose the paintings that they considered the most beautiful in the collection they had viewed. They did not make that choice while viewing them during the first part, but rather after becoming familiar with all of them. It allowed them to make an evaluation while taking into consideration the entirety of the exhibition. The aesthetic value of each painting was determined by how often it was indicated as beautiful by the subjects. There were no limitations concerning the number of paintings that each subject could choose.
Based on the aesthetic evaluations recorded during the second part of the experiment, all paintings were divided into four categories (with 8 paintings in each category). Category A included those paintings which were most frequently indicated by the subjects as the most beautiful. Categories B and C included those which were less often selected for their aesthetic value, while Category D consisted of those paintings which were the least-often deemed beautiful.
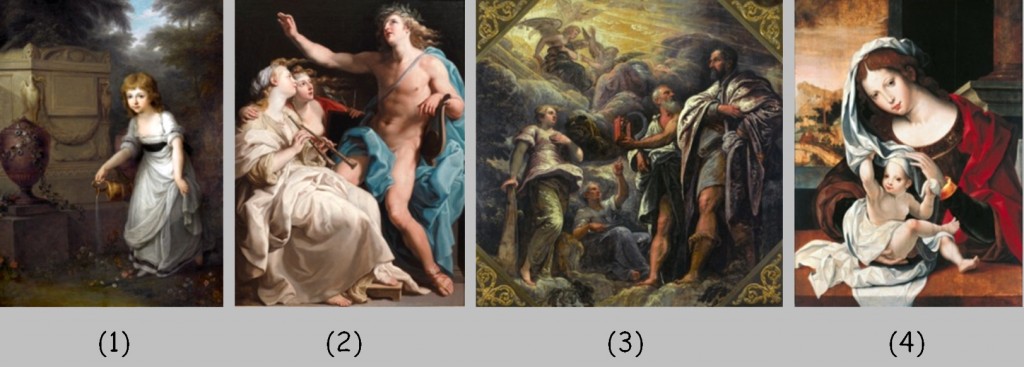
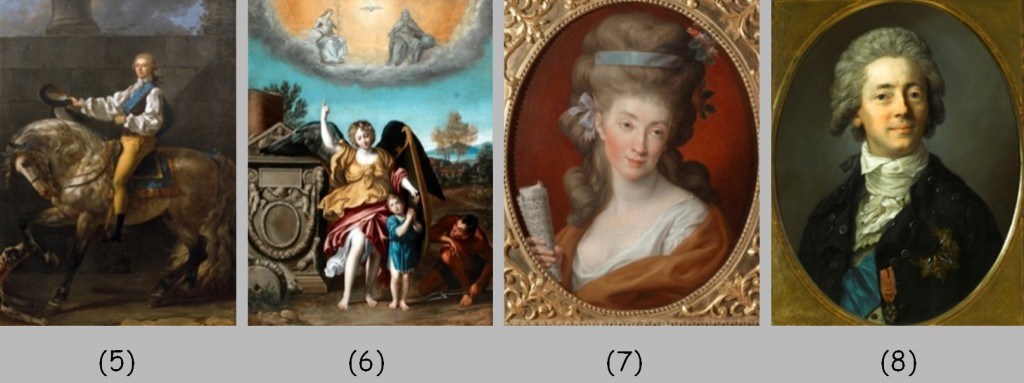
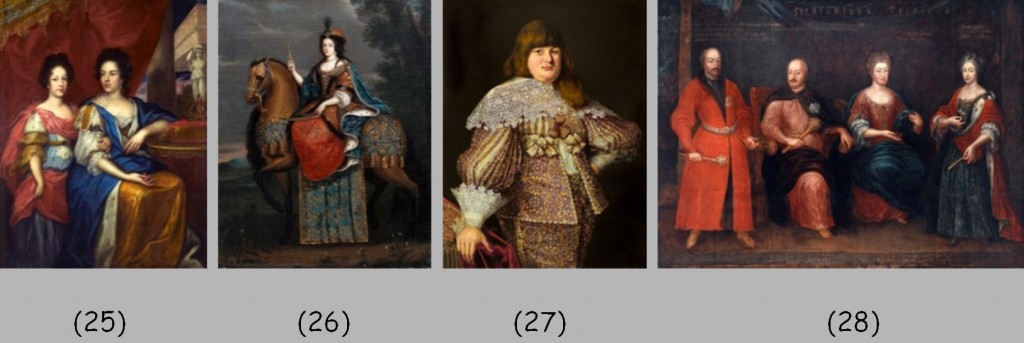
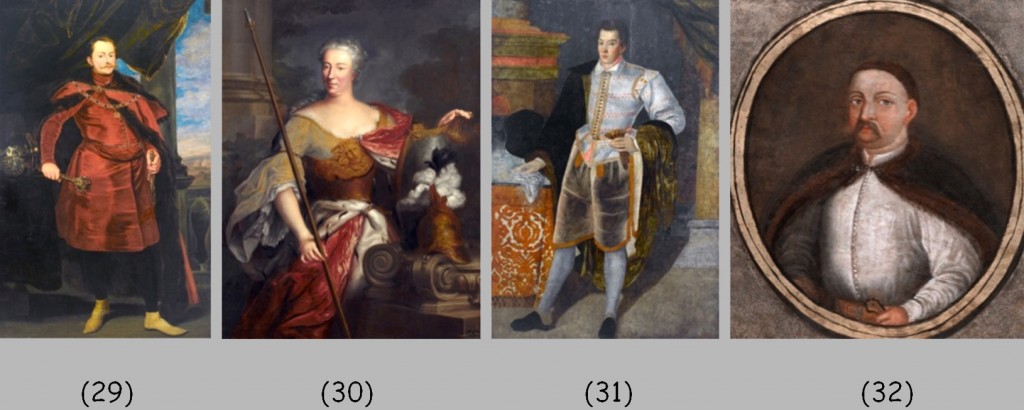
In Fig. 163 A and B and Fig. 164 A and B I present the paintings classified only in two extreme categories: A (beautiful) and D (non-beautiful). Paintings classified in category D cannot be considered ugly or completely devoid of aesthetic value. Therefore, I use the term “non-beautiful” to describe them, not “ugly” or “devoid of aesthetic value”. The numbers below each image reveal its aesthetic value out of all thirty-two paintings. Number (1) refers to the painting that was most often indicated as beautiful by the respondents, and number (32) — least frequently.
The division of images into categories is the basis for comparing the examined persons behaviour with regard to time they spent watching them and movements of their eyeballs during both — the first and second part of the experiment. All statistical analyses of the data collected were carried out having in mind the images belonging to all four categories.
Global time spent on looking at paintings
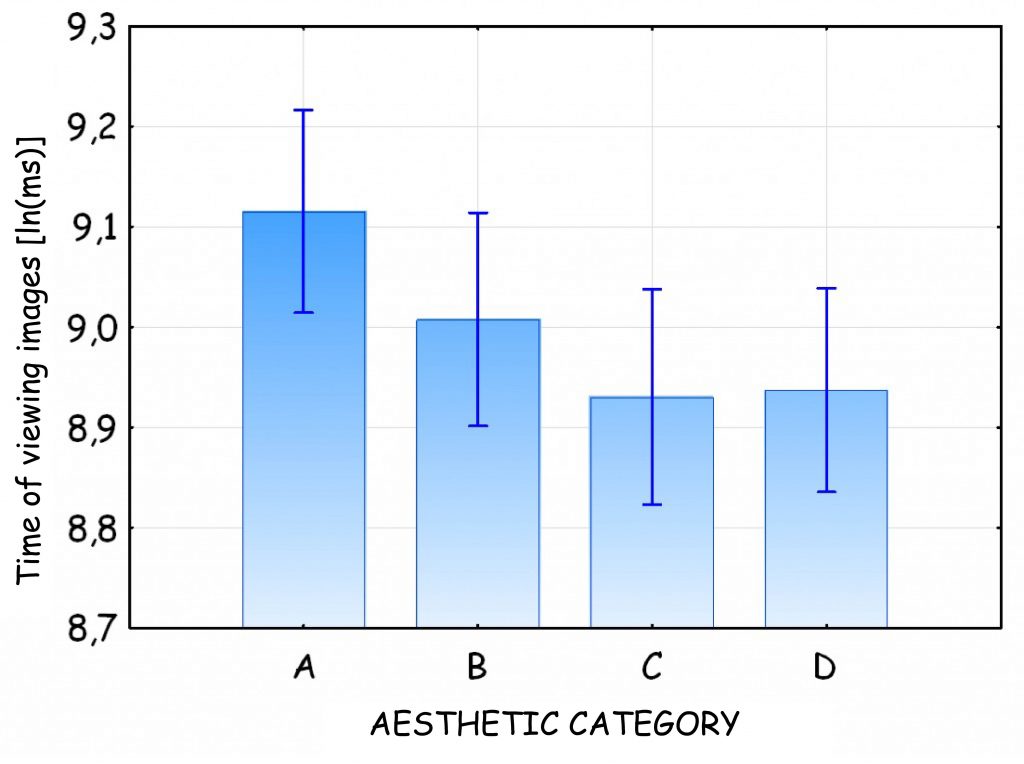
After breaking the images down into four categories I verified whether the studied people devoted an equal amount of time to watching them. I was also interested in how much time the studied people needed to watch the paintings in the first part of the experiment, and how much they need to decide on their aesthetic qualities in the second part. For this purpose, I conducted an anova variance analysis with repeated measurement within the scope of the variable, phase (I and II) and category (A, B, C, D) for the global time of watching the paintings. In order to normalise the distribution of data, the reaction times were subjected to logarithmic transformation.
First and foremost it turned that regardless of the painting category, the time devoted to watching them was four times longer than in the second part [F(1, 21) = 195.08; p < 0.001; η2 = 0,90; MPhase I = 9.13 s and MPhase II = 2.39 s]. It also turned out that between the time devoted to watching images and their aesthetic preference there is a straight-lined correlation: the studied people spent most time watching those images, which they evaluated as the most beautiful in the second phase of the experiment; they devoted a little less time to those which they found to be highly aesthetic, and the least — to those which were most rarely evaluated as beautiful [F (3, 63) = 4.90; p < 0.004; η2 = 0.19].
Interestingly, the effect became particularly apparent in phase I [F(3, 63) = 10.17; p < 0.001; η2 = 0.33; 165]. Obviously, the difference between the total time of viewing paintings belonging to categories A and D was statistically significant [Tukey’s HSD, p < 0.001]. In turn, in phase II, the differences between the categories turned out to be insignificant [F(3, 63) = 2.19; p < 0.098]. It means that the amount of time devoted to looking at a painting in order to judge it in terms of its aesthetics does not depend on the fact whether the observer does or does not like it.
Count and duration total of visual fixation on paintings
Nearly 86% of the time spent on viewing the paintings exhibited in the experiment was spent on visual fixations on its various parts. It is therefore not surprising that between the fixation duration total on paintings belonging to different aesthetic categories there is an analogous relationship, as between the total viewing time of these paintings and their aesthetic evaluation. Similarly, as in relation to total viewing time, the analysis of anova variance with repeated measures of two variables: phase (I, II) and category (A, B, C, D) was carried out for the fixation duration total on the whole paintings.
It appeared that the fixation duration total when viewing paintings in the first phase of the study was disproportionately longer than when making aesthetic decisions in phase II [F(1, 18) = 145.86; p < 0.001; η2 = 0.89]. The dependence between the fixation duration total on paintings in the first part of the experiment and the aesthetic preference expressed regarding them in the second was confirmed. The higher the aesthetic evaluation of the painting [F(3, 60) = 10.43; p < 0.001; η2 = 0.34], the longer the duration of fixation on the painting. Also the difference between the fixation duration total on paintings belonging to category A and D was statistically significant [Tukey’s HSD, p < 0.001]. As with total viewing time for paintings in Phase II of the study, there was also no effect of the CATEGORY variable for the fixation duration total [F(3, 57) = 1.76; p = 0.165], and the fixation duration on paintings belonging to categories A and D was almost identical [Tukey’s HDS, p = 0.99].
The second general parameter characterising eyeball movement, apart from fixation duration total, was the count of fixation points on the analysed painting. Just like the fixation duration total, the count of fixation points is highly correlated with the total image viewing time. For this reason, the count of fixation points during phase I (watching) was significantly higher than the count of fixation points during phase II [F(1, 21) = 50.91; p < 0.001; η2 = 0.74]. While viewing paintings in the first part of the experiment, the studied people more often fixed their vision on the paintings belonging to the higher aesthetic categories [F(3, 60) = 10.55; p < 0.001; η2 = 0.35]. The difference between the count of fixation points while casually viewing paintings belonging to category A and D was statistically significant [Tukey’s HSD, p < 0.001].
In the second part of the experiment, in which the respondents made an aesthetic evaluation, an interesting effect emerged, which I did not find in the analysis of global viewing time. At this stage of the study, there were significant differences in the count of fixation points on paintings belonging to different aesthetic categories [F(3, 63) = 3.25; p = 0.027; η2 = 0.13; Fig. 166]. However, this effect was not affected by the difference between A and D categories, which I have so far observed for viewing times in Phase I, but by the difference between B and D categories (Tukey’s HSD, p = 0.018). The highest count of fixation points appeared in paintings that belonged to category B, i.e. not the most beautiful ones, but the inclusion of which in category A could be particularly difficult for the respondents. The increase in the count of fixation points on paintings included in this category was most probably related to the uncertainty of the respondents as to their aesthetic value. They were confronted with the need to make a decision and preferred to once again “take a look” at more elements in these paintings in order to make the right decision. An analogous, although statistically insignificant, result appeared also in relation to the fixation duration total.
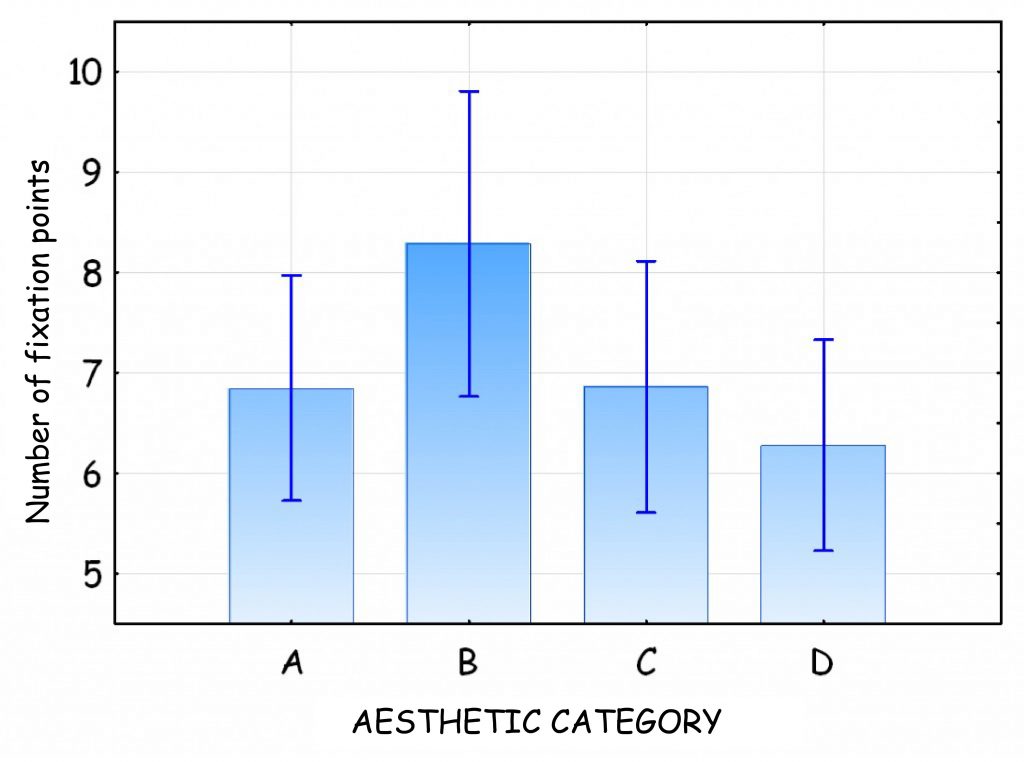
The parameter concerning the count of fixation points may also be expressed through fixation frequency, which means the count of fixation points over one second. As it turns out, within all categories, fixation frequency is significantly higher during aesthetic evaluation in the second phase of the experiment than while viewing the paintings in phase I [F(1, 18) = 15.63; p < 0.001; η2 = 0.47]. In other words, oculomotor activity increases significantly during aesthetic evaluation. However, no differences were identified in the fixation frequency in relation to different aesthetic categories, both in Phase I and Phase II. This result confirms the presented interpretation concerning the increased fixation count in Category B in Phase II. Decisions concerning the aesthetic value of a painting are accompanied by intensified oculomotor activity resulting from slightly increased emotional stimulation.
Another indicator related to visual fixations on a painting is fixation duration average. It constitutes the quotient of fixation duration total divided by their count. This indicator is particularly interesting due to the evaluation of sensory processing strength level. However, it turned out that the fixation duration average was more or less the same during the first and the second phase of the experiment [F(1, 21)= 3.48; p=0.076], as well as in relation to all aesthetic categories, both during casual viewing of the paintings [F(3, 63) = 0.56; p = 0.644] and during the aesthetic evaluation phase [F(3, 63) = 0.21; p = 0.887]. Of course, the differences between extreme aesthetic categories in both phases of the experiment were also statistically insignificant [Tukey’s HSD, phase I – p=0.999 and phase II – 0,930]. In other words, the level of engagement in the processing of data captured by the retinae of subjects was more or less the same regardless of the phase of the experiment and the category of the viewed paintings.
How did the sight travel across beautiful portraits, and how did it travel across the non-beautiful ones?
The second group of parameters of the eyeball movement trajectory are the saccades. Their objective is to shift the visual axis from one part of the painting to another. Saccades are measured in units of length, e.g. pixels located between two fixation points or millimetres, or in angular units. The distance between two fixation points is called the saccade amplitude. The sum of all saccade amplitudes recorded during viewing the entire painting determines the length of the scanpath. With this parameter I will begin to discuss the trajectory of eyeball movement while viewing Wilanów portraits.
Because of the much greater amount of time devoted to viewing images in the first part of the experiment, it is understandable that in this phase the eyes of the respondents “followed” much longer than in phase II. This obvious intuition is confirmed by the results of variance analysis [F(1, 21) = 192.00; p < 0.001; η2 = 0.90], in which, as before, phase (I and II) and category (A, B, C, D) constituted the independent variables, but this time the length of the scanning path expressed in logarithms of the number of screen pixels that divided the subsequent fixation points were the dependent variable. The use of logarithmic transformation in relation to various parameters of eyeball movements not only normalises their distribution, but also significantly reduces individual differences between the respondents, thus increasing the internal homogeneity of the compared groups.
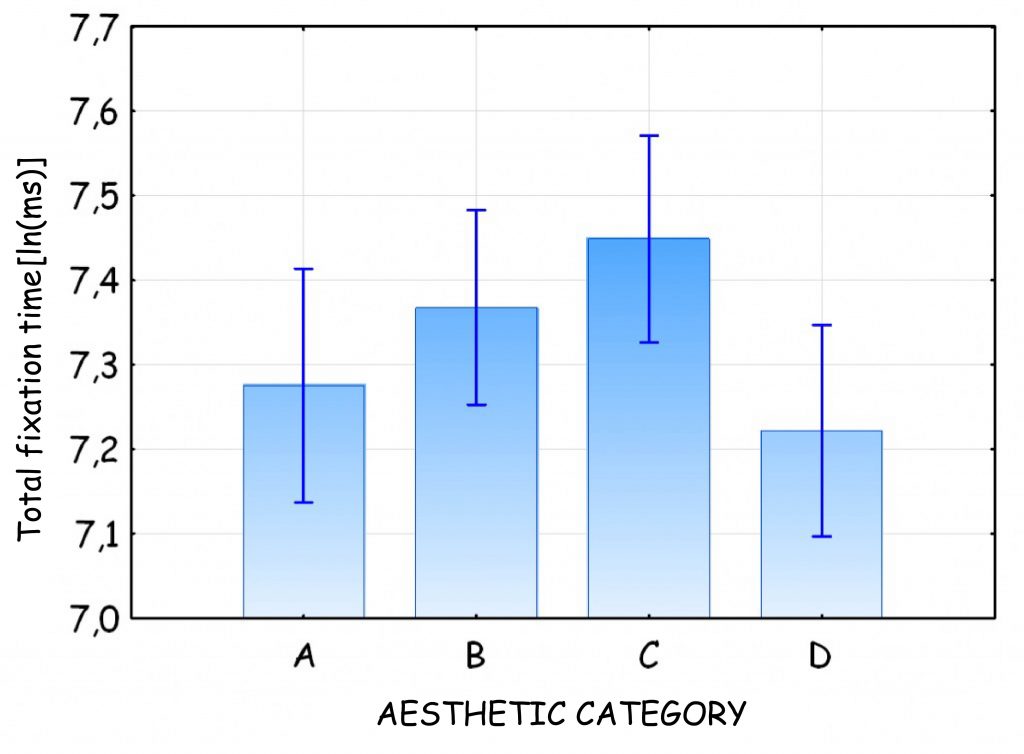
It also turned out that the total length of the scanpath was dependent on which category the painting belonged to [F(3, 63) = 7.35; p < 0.001; η2 = 0.26; Fig. 167]. Differences between categories A and C as well as B and C were statistically significant [Turkey’s HSD, p < 0.006 and p < 0.003 respectively]. This effect was similarly visible in both phases of the experiment.
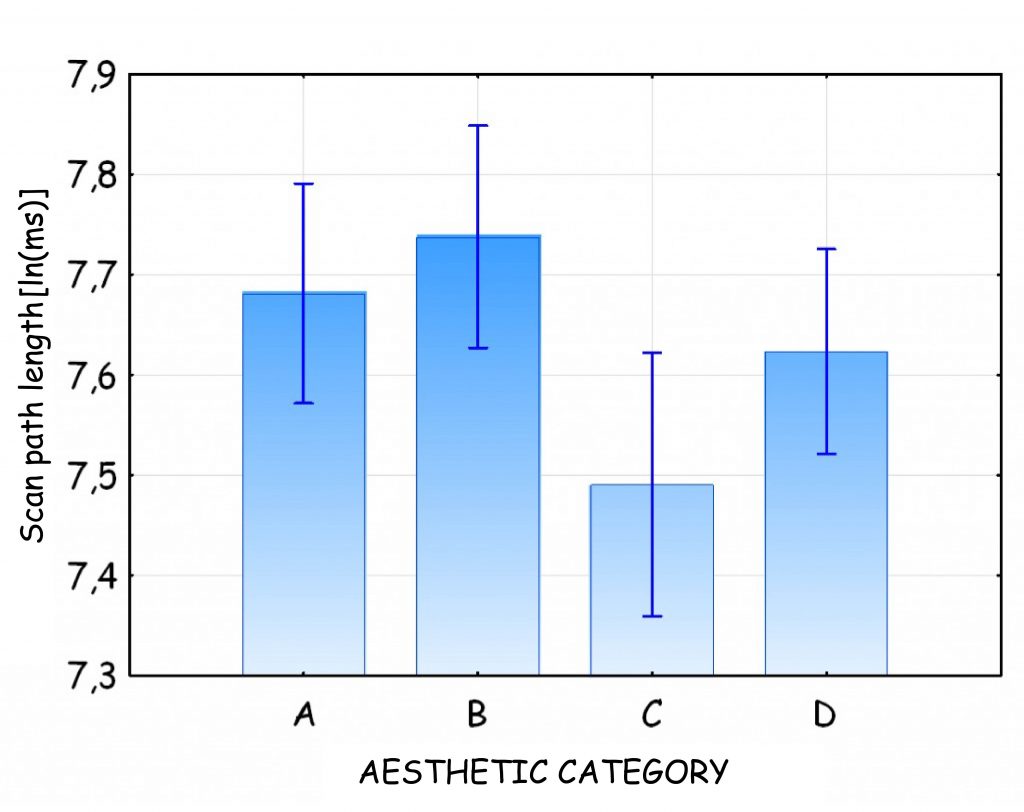
This result is worth noting for two reasons. First of all, it shows that more beautiful paintings (A and B) are viewed with greater involvement than paintings belonging to the other two categories. To a large extent, this result is a derivative of the longer duration and greater count of visual fixations on these paintings. Secondly, the biggest difference in terms of scanpath length is not in the case of those paintings that fall under category A or D, but those that are in between, i.e. B and C. It seems that category B paintings required the most attention from the respondents, while category C paintings required the least of all. Aesthetic evaluation of the kind: “rather beautiful” seems more difficult than “rather non- beautiful”.
Another measure of saccades based on their length is their average amplitude. This is the quotient of the scan path length by the number of saccades it contains. There were no statistically significant differences between the first and second phase of the experiment [F(1, 21) = 0.5; p = 0.487]. Average amplitude of saccades was similar in both phases of the study.
The variable that influenced the average amplitude of the saccades was category [F(3, 63) = 9.17; p < 0.001; η2 = 0.30; Fig. 168]. The effect in the same form was observed in both phases of the experiment. In contrast to the scanpath length, it was found that the average amplitudes of the saccades when viewing category A paintings, i.e. the most beautiful ones, were significantly shorter than the average amplitudes of the saccades when viewing category D paintings [Tuykey’s HSD, p = 0.017].
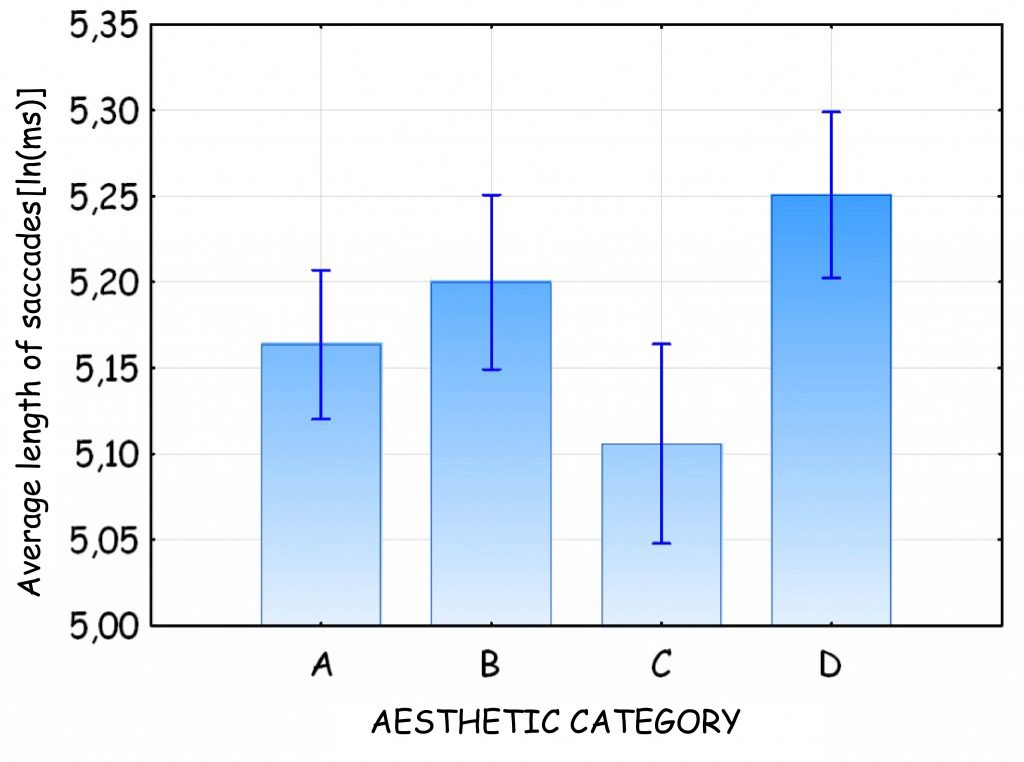
Such a result would suggest that in the case of more beautiful paintings, there is a tendency for more concentrated viewing of fragments of the paintings (the fixation points are located closer to each other), while in the case of “rejected” paintings, the tendency for more scattered concentration of vision on distant fragments is more pronounced. Without elaborating on this issue further here, I would just like to remind that such a viewing strategy is more characteristic for experts than novices. I will be looking at this issue again in the discussion of the results.
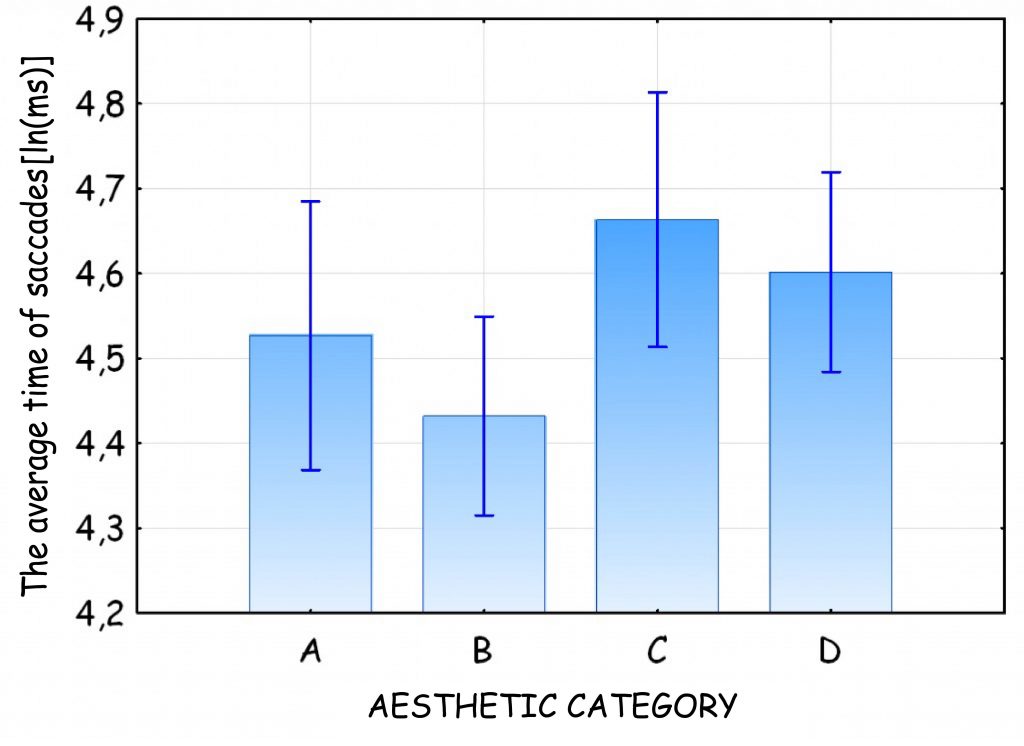
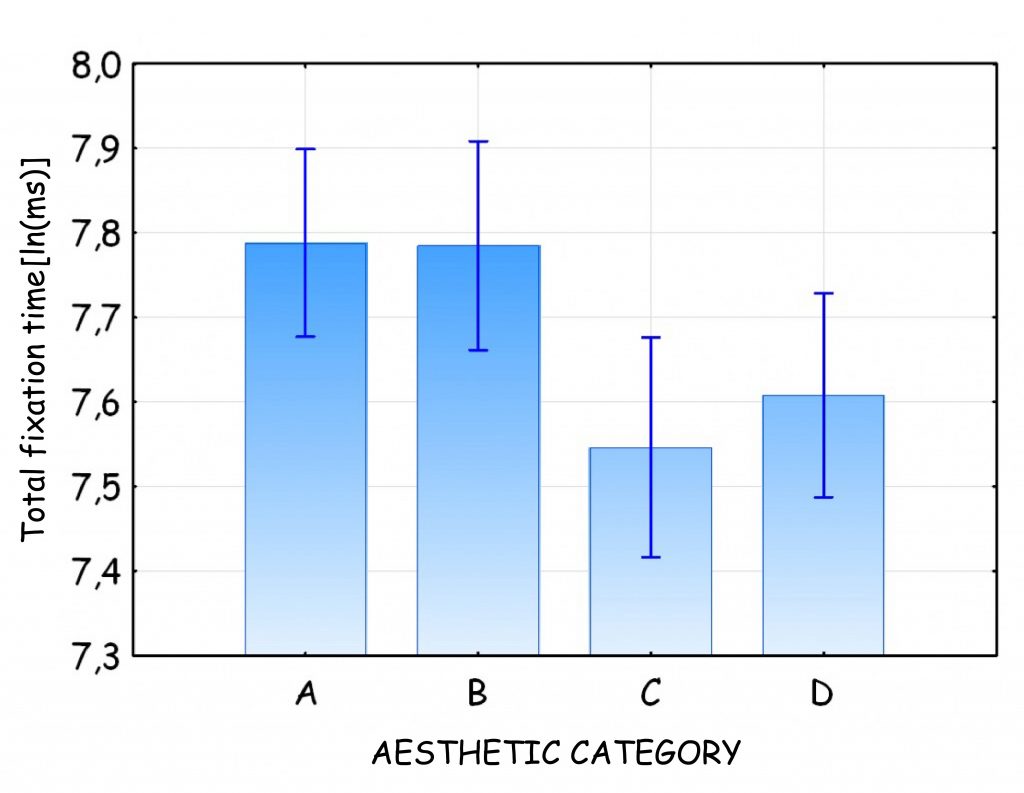
Each saccade is performed at a specific time. The average duration of the saccade is another indicator which I took into account in the analysis of oculomotor data. This is a very subtle parameter of the eye movement trajectory, considering that its length is about 1/10 of a second. It turned out, however, that twice as much time of vision shift was recorded when viewing paintings in phase I as during the aesthetic evaluation in phase II [F(1, 18) = 121,01; p < 0.001; η2 = 0.87; MFaza I = 71.3 ms, MFaza II = 159.5 ms] and for paintings more beautiful (categories A and B) than less beautiful (C and D) [F(3, 54) = 6.34; p < 0.001; η2 = 0.26; Fig. 169]. The differences between categories B and C and B and D are also statistically significant [Tukey’s HSD, p < 0.001 and p = 0.019 respectively].
The last of the analysed measures of saccades was their speed. As before, in relation to this parameter I also used the analysis of variance with repeated phase (I and II) and category (A, B, C and D) variables. It turned out that the saccades were much faster when viewing images (MPhaseI = 396o/s) than during their aesthetic evaluation (MPhase II = 290o/s) [F(1, 21) = 87.47; p < 0.001; η2 = 0.81]. There were also differences in the speed of the saccades when viewing paintings belonging to different aesthetic categories [F(3, 63) = 11.98; p < 0.001; η2 = 0.36]. The dependencies between the categories were similar to those of the scanpath length, which indicates a high correlation between the two parameters (Fig. 167).
Areas of major interest
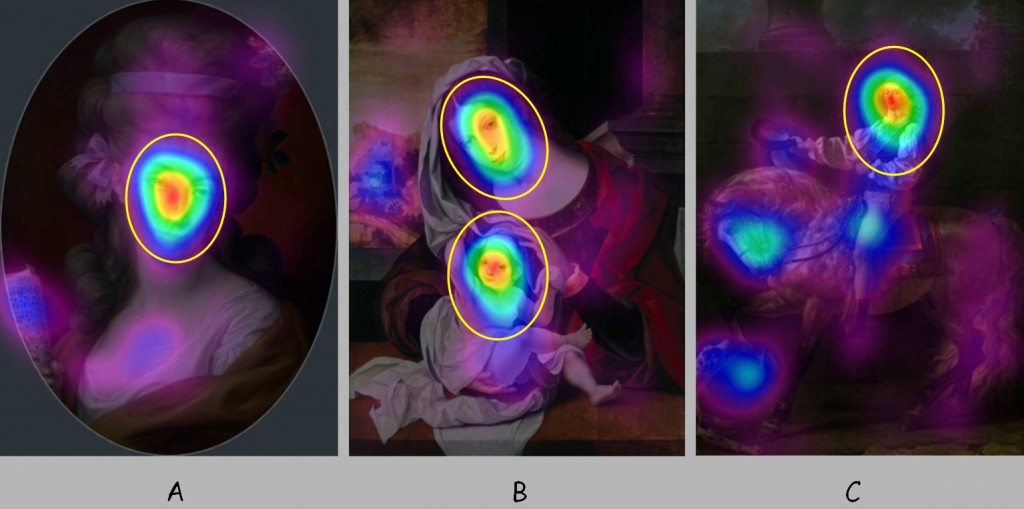
The analysis of the eyeball movement trajectory can be performed either for the whole painting or for a part of it which for some reason is of interest to the researcher or aroused special interest of the respondents. In all the presented paintings, the dominant element was a man. No wonder that no matter which aesthetic category a given painting belonged to, the faces of people present in it aroused the greatest curiosity. They were the main focus of the respondents’ glances, which is best reflected in the attention maps (Fig. 170 A and B).
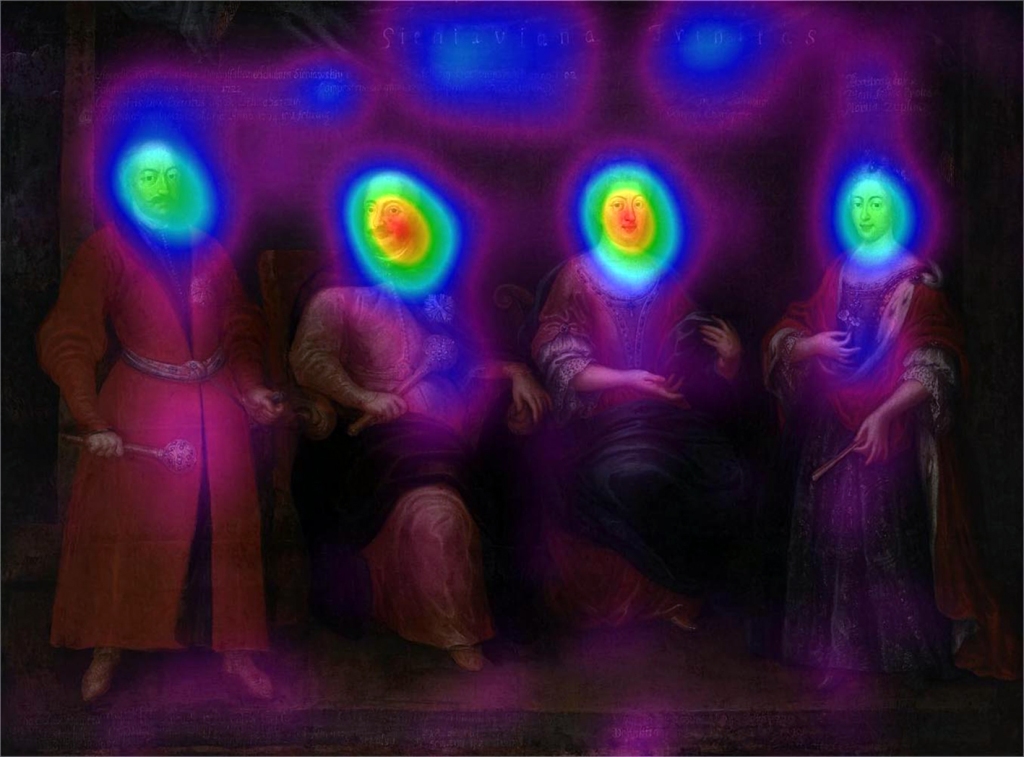
It should be reminded that the intensity of attention measured by the count and duration of fixation is presented graphically in Fig. 170 A and B by means of colors, where red means the greatest level of interest of a given fragment of the painting, then yellow, green, light and dark blue to fuchsia, i.e. a mixture of violet and pink. The remaining, dark areas mean those places that did not arouse the examined persons’ interest.
Based on attention maps, an elliptical shape with the same chords was established for all the paintings, covering the area or areas thereof that were of particular interest to the examined persons. It was the so called area of interest (AOI). This area surface in relation to surface of the screen — thanks to which the image was displayed was approx. 2%. It was so large, that it covered every face independently from its size (compare Fig. 171 A, B and C). The criterion for determining length of AOI chords was coverage of the attention map within the range from red to dark blue, inclusive. The examples of images showed in Fig. 170 and Fig. 171 leave no doubt that if they include faces, then the most time is devoted to them in comparison to all the other things in the picture.
Glances at the faces of the portrayed people and beyond them
The oculomotor data on the areas of the highest interest (AOI) as well as the rest of the images (non-AOI) can be analysed analogously as with regard to the entire images. The breakdown of painting space into AOI and non-AOI also makes it possible to conduct additional comparisons between the images belonging to various aesthetic categories. You can, for example, find out what role in the aesthetic evaluation was played by the aesthetic evaluation of the face alone. Are some paintings found to be beautiful because the faces of the depicted characters are good-looking, and others are not regarded as beautiful because the faces in them are ugly? If there was a significant correlation between the aesthetic evaluation of an entire image and the face depicted in it, we could expect that the variable category would similarly influence the oculomotor parameters for AOI, namely the faces, as for the entire paintings. In order to answer these questions I conducted anova variance analyses, similar to those conducted before — for variables: phase (I and II) and category (A, B, C, D), separately for AOI and non-AOI.
The first parameter, which is worth considering in the analysis of the trajectory of eyeball movement in a distinguished area of the painting is the fixation duration total, which makes it possible to get the general idea regarding the interest in the area. As a result of the conducted analysis it turned out that the studied persons fixed their vision on faces, namely AOI, in phase I for much longer than while performing the aesthetic evaluation of the paintings in phase II [F(1, 21) = 127,81; p < 0,001; η2 = 0,86]. As with the AOI, also outside the AOI, sight was fixed on images in phase I much longer than in phase II [F(1, 21) = 139.78; p < 0.001; η2 = 0.87]. These results only reflect the more general tendency, which was already found in the analyses of whole paintings, according to which the fixation duration total was longer in the first part of the study than in the second. In this sense, the result does not add anything new to what we already know.
The results of the analyses of fixation duration total with regard to the aesthetic categories are far more interesting. If we take a good look at the amount of time devoted by the participants to the faces on the portraits, namely AOI, we will come to realize that, indeed, there are statistically significant differences between them [F(3, 63) = 6.95; p < 0.001; η2 = 0.25; fig. 172].
The data presented in Fig. 172, however, do not reflect the dependence: the more beautiful is the painting, the longer it is viewed. On the contrary, the longest views, measured by the fixation duration total on the faces of the models, were recorded in the case of the paintings belonging to category C, that is those, the aesthetic qualities of which raised rather more than less doubts. But, first and foremost, it turned out that the differences in terms of time devoted to looking at faces in pictures belonging to categories A and D were statistically insignificant [Tukey’s HSD, p= 0.756]. The same effect was observed in both phases of the experiment, which only reinforces the hypothesis that the aesthetic evaluation of the paintings is not affected by the aesthetic evaluation of the faces of the portrayed people.
The analysis of the area outside the AOI revealed an even more interesting effect. When viewing paintings evaluated as beautiful, the respondents devoted much more time to areas outside the AOI than when viewing paintings belonging to the category of non-beautiful [F(3, 63) = 9.99; p < 0.001; η2 = 0.30; Fig. 173]. The differences between the paintings belonging to the more positively evaluated categories, i.e. A and B, and the paintings belonging to the more negatively evaluated categories, i.e. C and D, are statistically significant [Tukey’s HSD, A:C — p < 0.001, A:D — p = 0.015, B:C — p < 0.001, B:D — p = 0.017].
It is also noteworthy that the dependencies presented in Fig. 173 refer mainly to the first part of the experiment, during which the respondents without any time limits viewed the paintings presented to them [F(3, 63) = 18.51; p < 0.001; η2 = 0.47]. On the other hand, during making decisions regarding the inclusion of a given painting into categories of beautiful or non-beautiful, the total amount of time devoted to viewing areas that lie beyond the AOI was the same, independently to which category a given painting was finally classified [F(3, 63) = 1.99; p = 0.123].
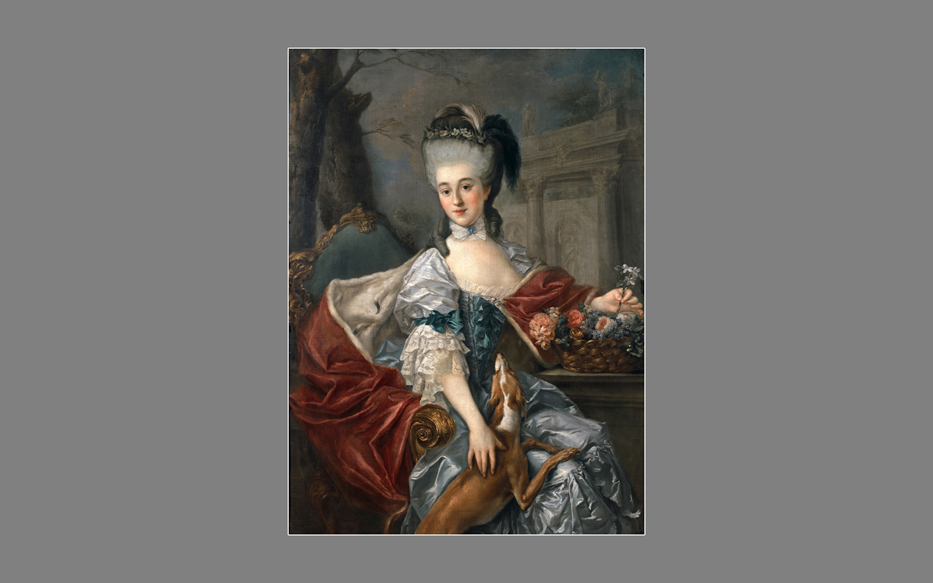
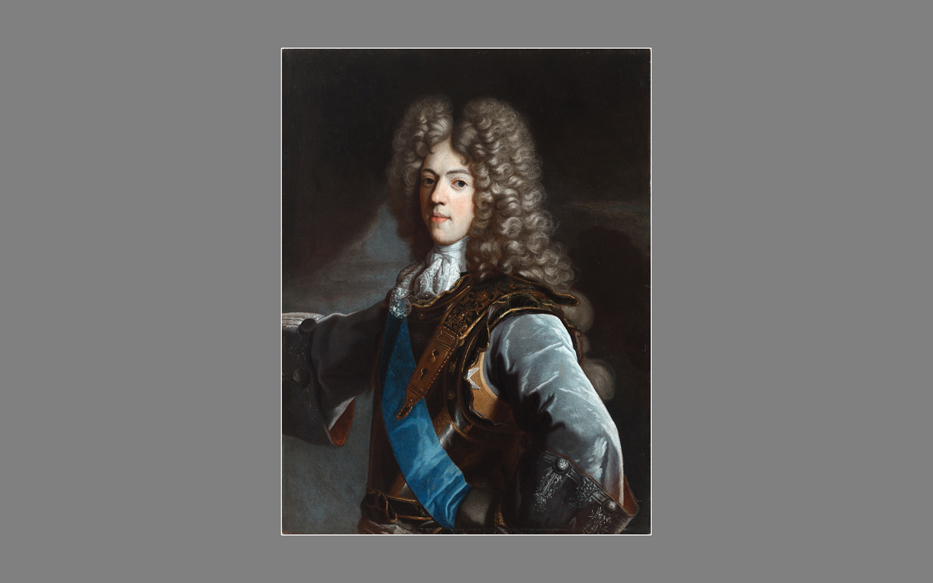
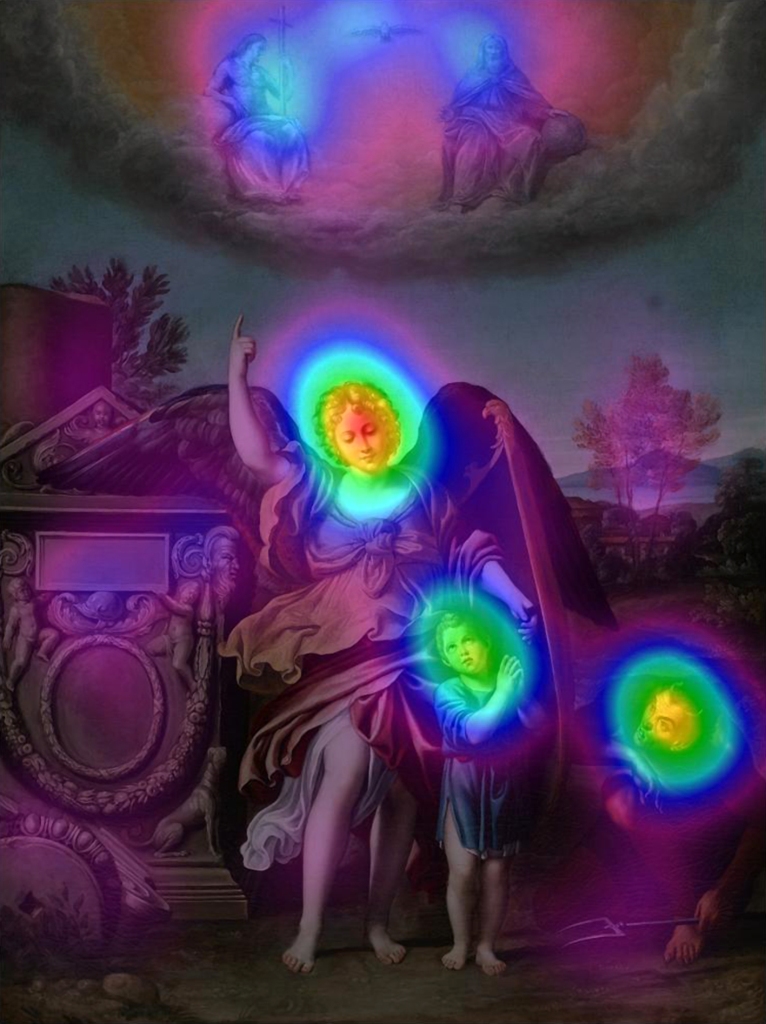
In order to understand the specific nature of a much longer time of viewing non-AOI areas in beautiful paintings compared to the same areas in non-beautiful paintings, it is worth to examine two pairs of paintings belonging to these categories. Their similarity in composition was assumed as the basis for their selection to illustrate the effect. The first pair are horse portraits of Stanisław Kostka Potocki and Maria Kazimiera Sobieska (Fig. 174), the second one — of the bust of Stanisław Kostka Potocki and Zygmunt Tarło (Fig. 175). The attention map was plotted on each of the paintings. It reveals the location and time of the respondents’ looks on different parts of these paintings.
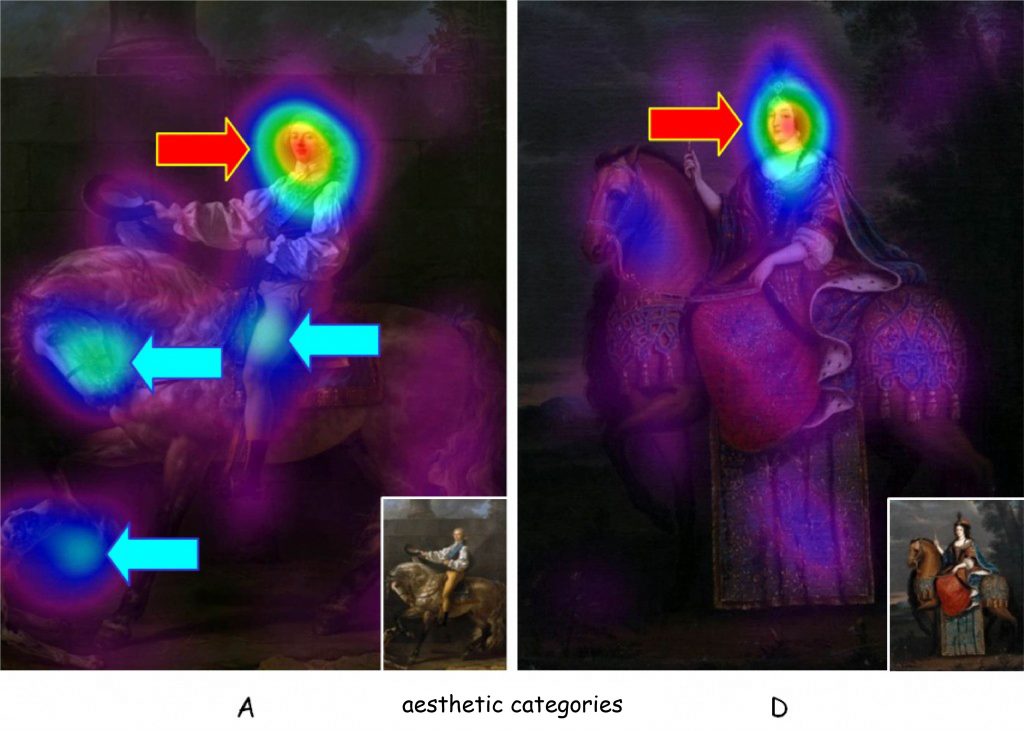
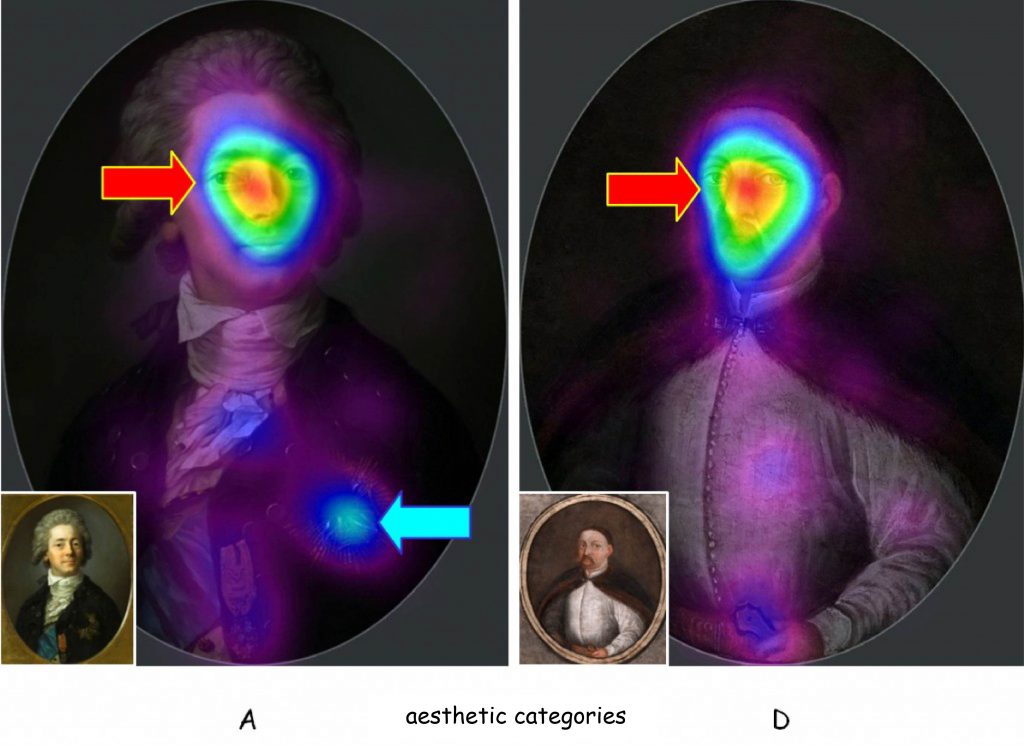
Both examples clearly show that, as I have pointed out on multiple occasions, the element that attracts the most of the viewer’s attention is the face of the portrayed person (as indicated by the red dots). However, it is not the duration of viewing the faces that determines the significantly longer total time devoted to viewing beautiful paintings as opposed to the non-beautiful ones. This is determined by the durations of looking at other parts of the paintings, as indicated by the bright-blue spots marked by arrows of the same color.
It is clear at first glance that the locations marked by brighter spots are present only in the paintings categorised as beautiful. They are the sources of differences in the total time of viewing beautiful and non-beautiful pieces of art. In Fig. 176, there are four parts of beautiful paintings which attracted viewers’ special attention. What do these parts contain? In two cases (A and B), they are parts of a richly-embellished horse harness, and in one case, it is a matt-shine part of a medal on Count Stanislas Potocki’s chest (D). A common feature of these parts is their shimmer and contrastive nature, which, however, are not enough to unequivocally reproduce the shapes of the painted objects. In this respect, they are mysterious; they attract the viewer’s attention and, at the same time, remain unseen in their full glory.
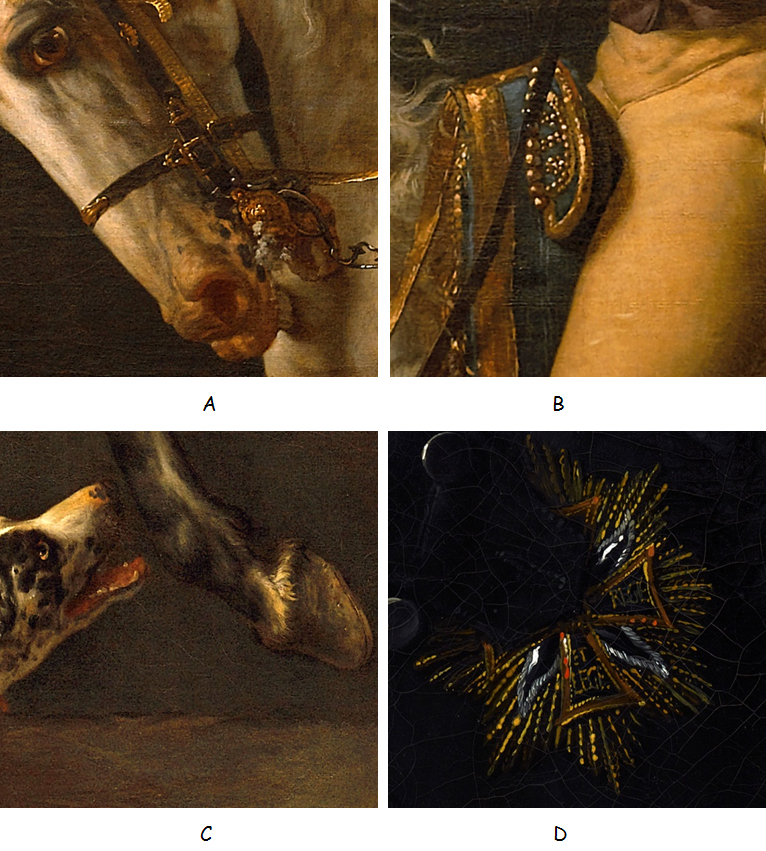
The trait of mysteriousness stemming from ambiguity may also be ascribed to the fourth of the selected parts ©. It depicts the head of a hunting dog, seemingly in attack position, but at the same time filled with fear in the presence of a huge horse whose hoof is much too close to the dog’s muzzle What is about to happen here? It appears that the horse is more interested in the dog than in the rider on its back. If the horse kicks the dog, it will undoubtedly retaliate with even more fury. What will then happen to the rider? This painting constitutes the last frame before the one in which we can expect substantial change in the action.
Roland Barthes (2008) refers to such parts (details) in a painting, which build tension through their ambiguity or uncertainty, as the punctum, as opposed to the studium, i.e. the fundamental subject of a painting. The subject of Jacques-Louis David’s painting is the portrait of Count Stanislas Potocki on a horse, who salutes the viewer with a studied gesture. However, Potocki is hardly the element which builds tension in this scene. It is that very part in the bottom left corner which attracts the viewers’ attention.
A few more words about visual fixations on AOI and non-AOI
After this brief qualitative analysis of the respondents’ areas of special interest in beautiful paintings, now is the time to refer to other results of statistical analysis of oculomotor data. To a large extent, they confirm the results of analyses of the fixation duration total on the paintings.
As with the fixation duration total on the AOI and on the non-AOI, also the count of fixation points on both these areas was greater during the first phase of the experiment than during the second phase [AOI: F(1, 21) = 43.45; p < 0.001; η2 = 0.67 and non-AOI: F(1, 21) = 50.70; p < 0.001; η2 = 0.71]. This result does not require any additional comment.
Also, the count of fixation points in the AOI turned out to be slightly different depending on the aesthetic category to which the painting belonged [F(3, 63) = 9.81; p < 0.001; η2 = 0.32]. However, the specificity of this differentiation was unique. It appeared that the count of fixation points in the AOI was very similar for the three categories of paintings: A, B and C, i.e. both beautiful, rather beautiful and rather non-beautiful. In contrast, the count of fixation points on the faces of portraits considered to be the least beautiful was significantly lower. Therefore, we cannot refer to any unambiguous influence of a category variable on the count of fixation points on beautiful and non-beautiful faces. A similar phenomenon also appeared in relation to the fixation duration total on the faces of the portrayed persons.
In turn, apart from the AOI, the results are more unambiguous and confirm the earlier findings. The count of fixation points for non-AOI was found to differ depending on the aesthetic category [F(3, 63) = 19.06; p < 0.001; η2 = 0.48]. In the paintings belonging to categories A and B, the respondents placed much more fixation points than in the paintings belonging to categories C and D. As with fixation duration total, all these differences in pairs are statistically significant [Tukey’s HSD, A:C — p < 0.001, A:D — p < 0.001, B:C — p < 0.001, B:D — p = 0.039].
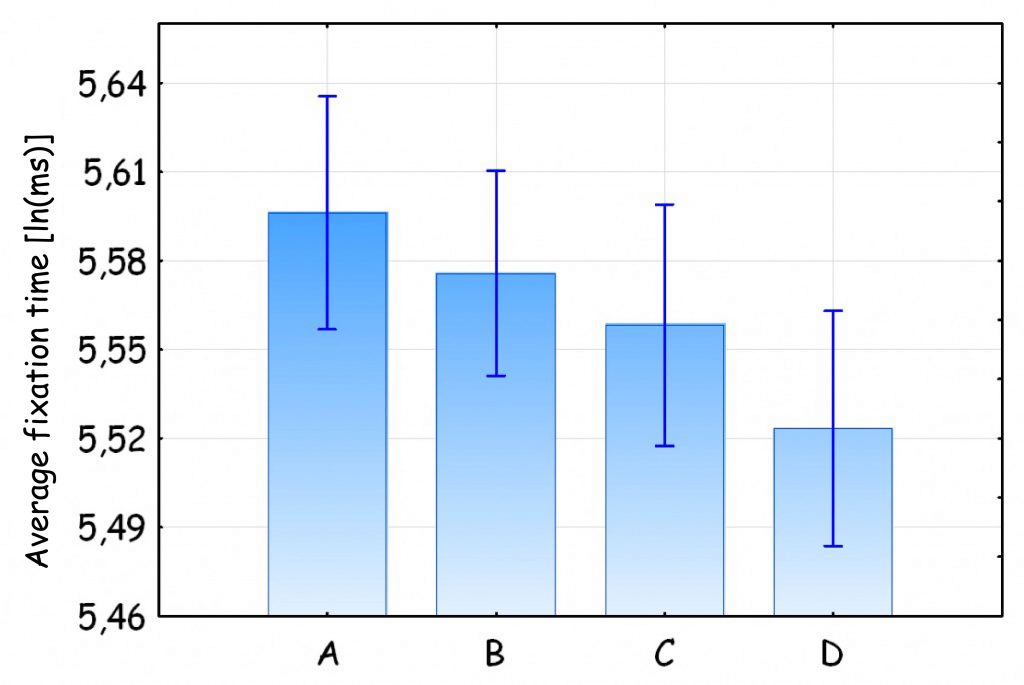
And finally, one more parameter of the eyeball movement trajectory, i.e. the fixation duration average on AOI and non-AOI. In relation to the faces of the portrayed persons, i.e. AOI, there were no statistical differences between the phases of study [F(1, 21) = 5.15; p = 0.090] and between the aesthetic categories [F(3, 63) = 1.73; p = 0.169] due to the fixation duration average. In short, the level of processing of sensory data collected during visual fixation on the faces of all portrayed persons was similar. This result leaves no doubt that the “aesthetic quality” of the face had no influence on the aesthetic evaluation of the entire paintings.
As for non-AOI, the data on fixation duration average significantly supports the hypothesis of the importance of these areas in the aesthetic evaluation of paintings. A much deeper level of sensory data processing accompanied the viewing of all paintings in the first part of the study than in the second part [F(1, 21) = 58.06; p < 0.001; η2 = 0.73]. It was also different depending on the aesthetic category to which the given painting belonged [F(3, 63) = 5.34; p = 0.002; η2 = 0.20; Fig. 177]. Of course, the difference between category A and D is statistically significant [Tukey’s HSD, p = 0.002].
What happens on the border between the AOI and beyond?
While viewing a painting, the observer directs his or her gaze to different parts of it and often returns to the places he or she has already seen. They are the so-called regressive saccades. If a particular fragment, e.g. the AOI, is identified in the painting, then the regressive saccades are an indicator of a kind of “border movement” between this area and the areas outside it. The number of regressive saccades registered at the border of the AOI may indicate a need to explore this area again as well as a need to explore an area outside it. The interpretation to be adopted depends on the interpretation of other parameters of the eyeball movement trajectory.
For obvious reasons, the number of regressive saccades in the first phase of the experiment was much greater than in the second phase [F(1, 21) = 19.42; p < 0.001; η2 = 0.48]. First of all, it results from the fact that the oculomotor activity during free viewing of paintings in phase I is much higher than during their aesthetic evaluation in phase II. Also interesting are the differences in the number of regressive saccades in relation to paintings belonging to different aesthetic categories. It turns out that the number of regressive saccades depends on which aesthetic category a given painting belongs to [F(3, 63) = 4,58; p = 0,006; η2 = 0,18]. When viewing the most beautiful category A paintings, there were many more regressive saccades than when viewing category D paintings [Tukey’s HSD, p = 0.020]. This proves the high oculomotor dynamics when viewing beautiful paintings, compared to non-beautiful ones.
Observing paintings in time
In the analyses presented, I have taken into account different aspects of time spent on viewing the paintings: total time determined by the image exposure time, as well as fixation / saccade duration total / average. None of these oculomotor parameters has been analysed so far, taking into account dynamics of changes in the subsequent stages of looking at paintings over time. Suppose one is looking at a painting for 30 seconds. Is the fixation count, fixation duration average or saccade length the same at the beginning, in the middle and at the end of this time? Is the possible dynamics of changes within the scope of these parameters the same, with regard to beautiful and as non-beautiful paintings?
In order to answer these questions, the global time spent observing every painting by each examined person was divided into four quarters, hereinafter referred to as “painting observation stages”. Of course, the length of individual stages differed slightly depending on examined person and painting, but on average it fluctuated around approx. 2 s [SD = 1.54]. Then, the following values of three oculomotor parameters were estimated for each phase: the fixation duration average, the saccade length average and the saccade duration average that underwent the analysis of anova variance with repeated measures of two independent variables: category (A, D) and phase (1, 2, 3 and 4) In these analyses I limited myself to only two extreme aesthetic categories and to the first phase of the experiment. Above all, I was interested in whether, based on the oculomotor data from the subsequent stages of viewing the paintings in the first part of the experiment, an aesthetic decision could be predicted, in the second part.
The analysis of the fixation duration average has delivered some puzzling results. It turned out that between successive stages of observing the paintings, statistically significant differences exist [F(3, 63) = 12.88; p < 0.001; η2 = 0.38]. On the other hand, at the level of the principal effects, differences between categories were insignificant, what confirms the results of earlier analyses of this parameter. However, the most interesting was the result of interactive influence of both independent variables on the fixation duration average [F(3, 63) = 2.68; p = 0.054; η2 = 0.11; Fig. 178).
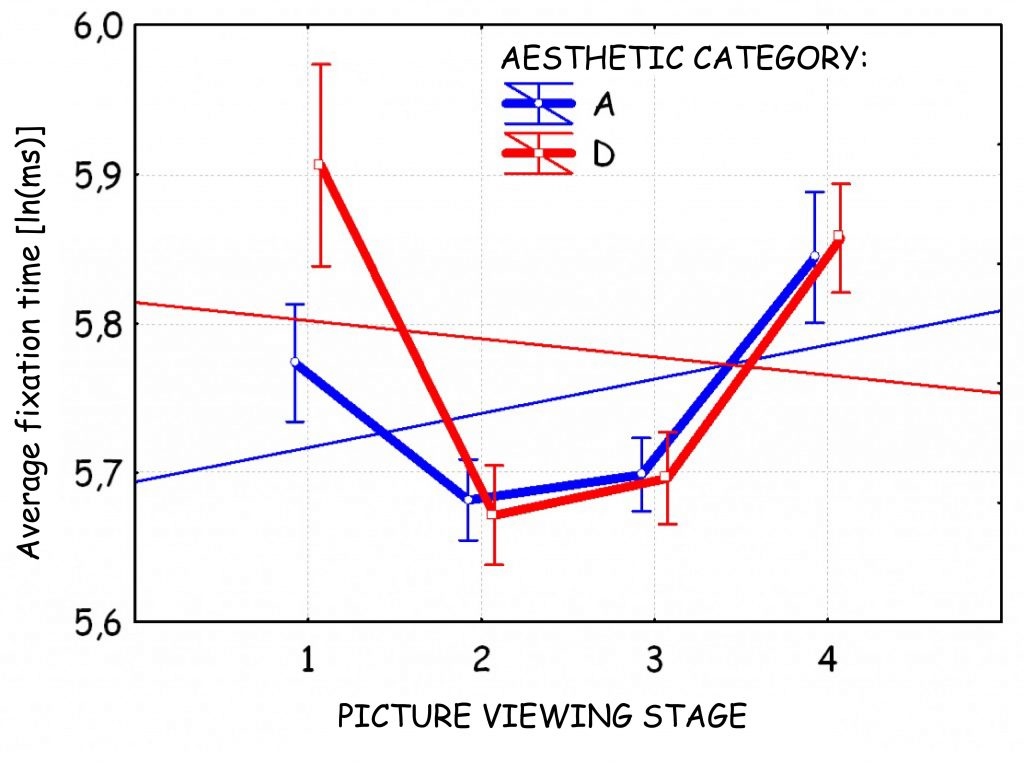
The longer fixation duration average in the first phase of viewing, was shortened in phase 2 and 3 and then returned to the initial value in phase 4. Nevertheless, a difference between fixation duration averages on paintings belonging to both extreme aesthetic categories at phase 1 [Tukey’s HSD, p = 0.038]. It indicates that already during the first 2 seconds after stimulus exposure, the examined persons devoted much less time to analysis of sensory data from subsequent fixation points on these paintings which were indicated as beautiful in the second phase of the experiment, compared with fixation duration averages on paintings that were regarded as non-beautiful in the second phase of the experiment.
How is that possible? Could it be that the moment of aesthetic evaluation of a work of art being viewed is ahead its more accurate, visual analysis? Is it possible that the visual data collected during the subsequent phases of viewing the painting do not influence its later evaluation? The presented results of the analyses of fixation duration average shed an interesting light on the moment of the emergence of aesthetic judgement. The assumption, according to which the aesthetic judgement is preceded by a deeper analysis of a work of art, underlaid the previous analyses. It is possible, however, that it is precisely the other way around.
In Fig. 178 I also marked graphs of two linear functions, best adjusted to the fixation duration averages recorded for subsequent phases of viewing paintings belonging to categories A and D. With regard to the paintings belonging to category A, namely evaluated as beautiful, an upward trend (thin blue line) can be found, whereas in the case of paintings belonging to category D, the fixation duration average becomes shorter during the course of painting viewing (thin red line).
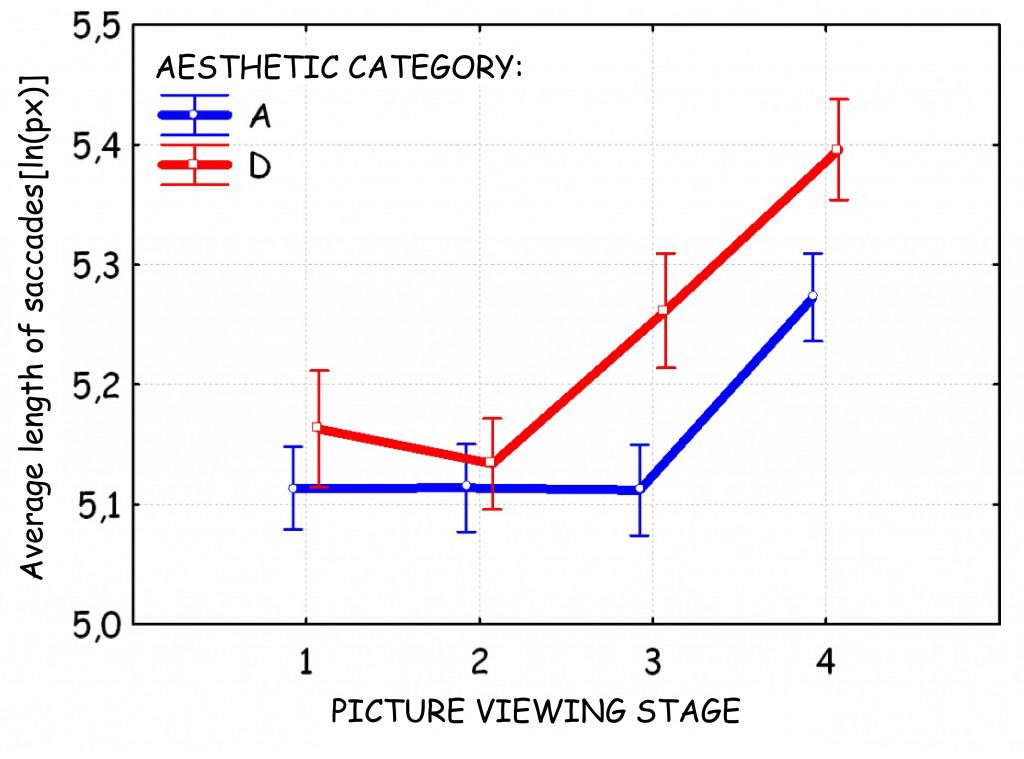
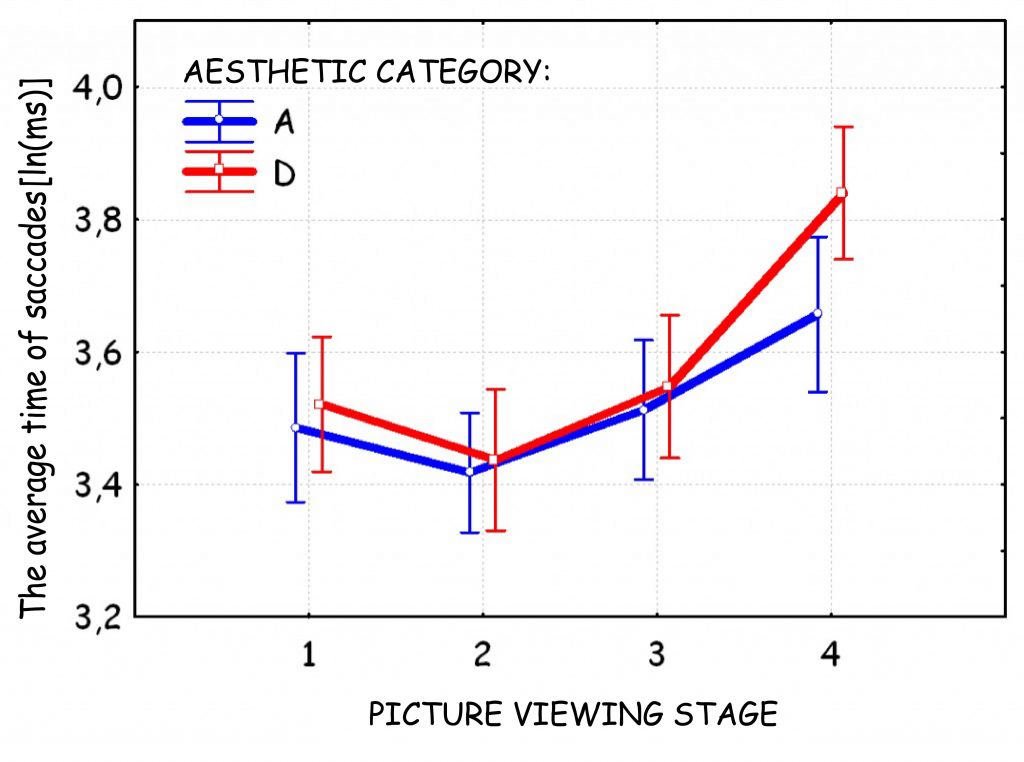
Using the variance analysis I also analysed the influence of the independent variables: category (A and D) and phase (1, 2, 3 and 4) on the average length of saccades and the average time of their duration. It turned out that the average saccade length increased during the viewing [F(3, 63) = 21.89; p < 0.001; η2 = 0.51; Fig. 179], just like the average time of their duration [F3, 63 = 0.71; p = < 0.001; η2 = 0.32; Fig. 180]. Obviously, both dependent variables have turned out to be vulnerable to the impact of the variable ‘category,’ which was the subject of analysis earlier (cf. Fig. 168 and Fig. 169). However, there was no interaction effect between the variables ‘category’ and ‘viewing stage’ in relation to these dependent variables.
Short summary and discussion of results
The presented analyses of oculomotor data of people who viewed and then evaluated paintings in terms of aesthetics reveal many interesting regularities, allowing for optimistic outlook regarding the possibility of using oculography technique to study even such subtle categories as beauty. On the one hand, it turns out that on the basis of parameters concerning the eye movement trajectory, one can predict the aesthetic preferences of the subjects. Furthermore, these data constitute empirical support for these aesthetic concepts, according to which the aesthetic judgement is ahead of the analysis of the evaluated work’s content (Gołaszewska, 1984; Tatarkiewicz, 2009). On the other hand, these data in no way ultimately settle anything in the terms of beauty perception. They do not give any formulas for how to create works that will be liked, although they undoubtedly give some tips. These results are rather an illustration of the research possibilities that oculography techniques open, the purpose of which is to record and analyse the eye movement while viewing paintings. So let us remind and briefly comment on a few of them.
The time regarding casual viewing paintings, i.e. without having to make value judgments about them, was much longer than the time regarding viewing them while making aesthetic decisions. This relationship seems quite obvious, because it is a simple consequence of the instructions, which before the phase I of the experiment encouraged the subjects to view the collection casually and gave them full freedom to decide on the time of viewing each painting. According to the instructions given before the second phase of the experiment, the subjects were to aesthetically evaluate the paintings which they had already viewed. In this phase, the subjects were not time-limited either, but they did not need to devote as much time to this task as before, because they had already had sufficient visual knowledge regarding each painting.
Much more interesting is the result concerning the relationship between the amount of time spent on viewing paintings belonging to different aesthetic categories in both phases of the experiment. During the free-viewing task, the subjects assigned higher aesthetic values for the paintings they looked at much longer than those they looked at for a shorter time. Seemingly, it would seem that this result is consistent with the results of many other experiments in which a similar relationship has been found (Vartanian, Goel, 2004b). Nevertheless, there is a fundamental difference between them. It has transpired that while making an aesthetic judgment, which was separated from aesthetic experience (at least operationally as part of this study), there are no differences regarding the time of viewing paintings belonging to different aesthetic categories. The decision about belonging or non-belonging of a given painting to the category of beautiful paintings is taken by the respondents just as quickly.
To sum up, when we view paintings casually, our gaze is focused for a longer time on those that we like more, but we make a judgment about them as quickly as in relation to those paintings to which we pay much less attention when viewing. Such a distinction between experience and aesthetic judgment is reflected in the results of analyses on almost all parameters of the eye movement trajectory, except for those that divide the time of viewing paintings into subsequent stages.
The results concerning the fixation duration total on different fragments of the viewed paintings reflect the results concerning their total viewing time. First of all, the subjects much more focused their gaze on paintings viewed in phase I than in phase II. Secondly, the fixation duration total was much longer while casual viewing paintings. The paintings belong to the most beautiful categories than those that were rated lower due to aesthetic reasons. Thirdly, while making aesthetic judgments, the fixation duration was similar with respect to various aesthetic categories.
The fixation duration total is an indicator of general interest in sensory data, i.e. the content of those fragments of the viewed painting that have intersected the observer’s visual axes. Therefore, beautiful paintings aroused greater interest than less beautiful ones (Hauland, 2003; Latimer, 1988; Mello-Thoms, Nodine and Kundel, 2002).
The relationships between the fixation duration total also apply to the count of fixation points. There are many more of them in the I phase of the experiment than in the II one, more during free viewing of paintings belonging to the higher aesthetic category than to the lower one, and more or less the same in relation to paintings belonging to different aesthetic categories while evaluating them in the II part of the experiment.
The count of fixation points, recorded while viewing the painting, is one of derivatives of its viewing time. However, it is also an indicator of the strategy of exploring the viewed painting (Massaro, Savazzi, Di Dio, Freedberg et al., 2012; Zangemeister, Sherman and Stark, 1995). Objects that are known, typical or uninteresting generally do not require visual attention for a longer time. Most often, they do not require analytical switching of eyes from one image detail to another one. A much larger count of fixation points on various fragments of paintings evaluated to be particularly beautiful may therefore imply that they have something unusual, unknown, and interesting. If there are more of them (in relation to more beautiful paintings than less beautiful ones), it could mean that an element of novelty, surprise or the presence of some detail in the image, which requires more attention, is one of the components of aesthetic experience. Taking as a basis the indicators of fixation duration total and fixation count, it is worth analysing two other parameters of the eye movement trajectory that capture the ratio of duration to their count. These are: fixation frequency and fixation duration average.
The fixation frequency is the ratio of the count of fixation points to their fixation duration total, while the fixation duration average is the ratio of the fixation duration total to their count. Therefore, both indicators imply more or less the same phenomenon, i.e. the observer’s average involvement in processing perceptual data, averaged for all fixation points (Massaro, Savazzi, Di Dio, Freedberg et al., 2012).
The fixation duration average is an indicator of the strength of perceptual data processing (Duchowski, 2007; Molnar, 1981). When focusing on one point of the image, not only sensory data is recorded using receptors located in the retina, but they are also transmitted to the cortical structures of the brain and subjected to complex analytical processes, which results in the decision to move the eyeball to another place of the image. These processes generally take place outside consciousness and often beyond the observer’s will as well. The harder to interpret the sensory data, the longer it is analysed. These millisecond times for performance of individual neurophysiological and cognitive activities aggregate, determining the total duration of single fixation. A longer fixation duration average on a specific fragment of a given painting most likely indicates a greater cognitive effort related to its interpretation. It is the result of higher requirements for cognitive data processing that is currently in the field of vision (Rayner, 1998). This would imply that more beautiful paintings (in contrary to less beautiful ones) contain more ambiguous elements that require more time to watch them.
The results of the analysis on the fixation duration averages and fixation frequencies partly confirm these assumptions. It transpires that while the values of both indicators are actually longer when casual viewing paintings than while making aesthetic judgments about them, they do not differ – both in phases I and II of the experiment – depending on the aesthetic category of paintings. These results imply that while aesthetic experience is accompanied by a deeper, cognitive analysis of sensory data, there is a quick decision-making process (referring to knowledge formed during earlier viewing of a painting) during the aesthetic judgment. It cannot be excluded that the subject of the evaluation is not so much the scope of content of the works viewed, but rather the amount of cognitive effort put into their interpretation. However, this relationship seems to be much more complex. It is difficult to agree with the fact that the more cognitive effort the observer puts into the cognitive interpretation of a given painting, the more (s)he likes it. It is possible that an important factor influencing this relationship is allowing the subjects to choose the amount of time they want to spend on viewing a work. However, there are probably some ranges of this involvement that are optimal from the point of view of aesthetic evaluation of the work.
Summarising the current discussion concerning the fixation points on viewed paintings, two phenomena can be formulated.
Firstly, according to, adopted in the present research, operationalisation of aesthetic experience and aesthetic judgment for phase I and II of the experiment, it can be stated that they are managed by various neurophysiological systems. These systems are responsible for the visual exploration of the perceptual field and the strength of sensory data processing. Aesthetic experience is characterised by a much greater exploration of the perceptual field and more analytical, as well as more involved, processing than aesthetic evaluation. Metaphorically speaking, the making of an aesthetic judgment does not require a “return to the image” but it is based on internalised assumptions formed during the aesthetic experience.
Secondly, although it has transpired that (in relation to paintings that were rated higher because of their aesthetic value) the fixation duration total and count of fixation points increase while casual viewing paintings, it is possible that this effect is caused by the global length of time spent on analysing paintings in the part I of the experiment.
The second group of indicators for eye movement trajectory is a saccade.
The total scanpath length is equal to the length of the path which the eye follows on the plane of the painting during its exposure. Similarly to the total fixation duration indicator, the length of the scanning path of a given painting is also one of derivatives of its viewing time. Therefore, since the amount of time spent on viewing paintings in part I of the experiment was significantly longer than the amount of time spent on making an aesthetic judgment, it is not surprising that the scanning paths for paintings during their free viewing were much longer than during viewing them just before the aesthetic evaluation.
Referring to global time spent on viewing paintings, one can also explain the effect of a significantly longer scanning path for paintings with higher aesthetic value, in comparison to the category of paintings with lower aesthetic value, as part of the collection in question. Obviously, this is only about the phase I of the experiment, as the differences between the total scanpath lengths, when viewing paintings belonging to different aesthetic categories, were very similar in the phase II. One can find out if the aesthetic category has an impact on the saccade length by estimating the indicator of average saccade length, i.e. the quotient of the total scanning path by the saccade number.
The analysis of the average saccade length has revealed interesting relationships. It has transpired that although total scanning paths of the paintings during the phase I of the experiment were much longer than during the phase II, the average saccade length was almost identical in both stages of the experiment. This means that due to this indicator, experience and aesthetic judgment do not differ from each other. It has turned out that during both the aesthetic experience and the aesthetic judgment, saccades are significantly shorter in relation to paintings with higher aesthetic values, than in relation to paintings with lower aesthetic values.
The average saccade length is interpreted in terms of the cognitive strategy adopted by the observer (Humprey and Underwood, 2009; Massaro, Savazzi, Di Dio, Freedberg et al., 2012; Zangemeister, Sherman and Stark, 1995). Long saccades, or eye movement to distant fragments of the image, rather indicate a strategy of global searching the perceptual field in order to build something like a cognitive map of the image. Initial phases of viewing an image are frequently characterised by long saccades. In particular, this applies to scenes that contain new objects or relations between them that are not always understood at first glance. Long saccades allow cognitive reconstruction of the image composition. In turn, short saccades indicate a more local analysis of a small fragment of the painting, which requires more detailed exploration for some reason. They may be a manifestation of difficulties in recognising an object in the scene or an expression of the need to decide on the meanings contained in a given fragment.
The people surveyed in the presented experiment belonged to a group of laymen in the field of art, therefore it can be assumed that they used more bottom-up than top-down, and rather local than global, strategies. On the basis of the available data, however, it cannot be determined whether they used top-down or bottom-up strategy, but the fact is that for more beautiful paintings they more often performed shorter saccades than for paintings which were rated lower due to their aesthetic value. On the one hand, this may mean that they were simply more analytically involved in solving some local problems related to their interpretation. This is a typical behaviour of novices in the field to which visual scene relates. On the other hand, longer amplitudes of saccades when viewing paintings belonging to lower aesthetic categories would rather indicate behaviour typical of experts. After all, experts are more likely to use global strategies than laymen (Zangemeister, Sherman and Stark, 1995).
The juxtaposition of these two points of view sheds an interesting light on the relationship that occurs among the eyeball saccades, being an expert or a layman in the field of art and the aesthetic evaluation of a given work. The laymen surveyed in the field of art viewed less beautiful paintings in accordance with global strategy, i.e. they behaved like experts. However, they behaved as novices while viewing beautiful paintings, using rather local strategies of searching the perceptual field. Perhaps the paintings to which the subjects attributed lower aesthetic grades are simply more typical and predictable. In more beautiful paintings, they discovered visual riddles in turn, which raised cognitive anxiety in them and held their visual attention on some fragments longer.
Being an expert in a given field is tantamount to knowledge of objects belonging to this field. If so, the expert generally does not carry out a detailed analysis of the familiar object and rather uses a global strategy of searching the perceptual field. Simultaneously, the accompanying sense of familiarity with specific objects (e.g. paintings) makes them less interesting, less mysterious, and more banal. From here, it is only one step to their lower aesthetic evaluation. For a novice in turn, many objects belonging to an unknown field may seem mysterious, intriguing and involving. Symptoms of these situations are visible in the eye movement trajectory recorded when the examined paintings of category A were viewed: shorter amplitudes of saccades, longer time spent on viewing them, and a greater fixation count. This interpretation of the experiment’s results is characterised by the following paradox: the more someone sees themselves as an expert in the field of art, the more difficult is to see beauty in the paintings viewed.
Certainly, the results of the presented studies do not explain the aesthetic sensations in a fully satisfactory way, using their oculomotor indicators. Instead, they reveal some interesting clues that can (and even should) become the subject of a further experimental study. First of all, one should examine to what extent the relationships presented here relate to other types of paintings, e.g. landscapes or abstract works. Undoubtedly, the study of oculomotor activity seems to be the most natural form of collecting data on the behaviour of people viewing works of visual art. The presented analysis confirms this intuition completely.