Mental phenomena, all conscious and unconscious mental phenomena, visual or auditory experiences, experiences of pain, tickles, itching, thoughts, certainly the entirety of our mental life, result from the processes that take place in our brains (Searle, 1995)
General structure of visual pathway
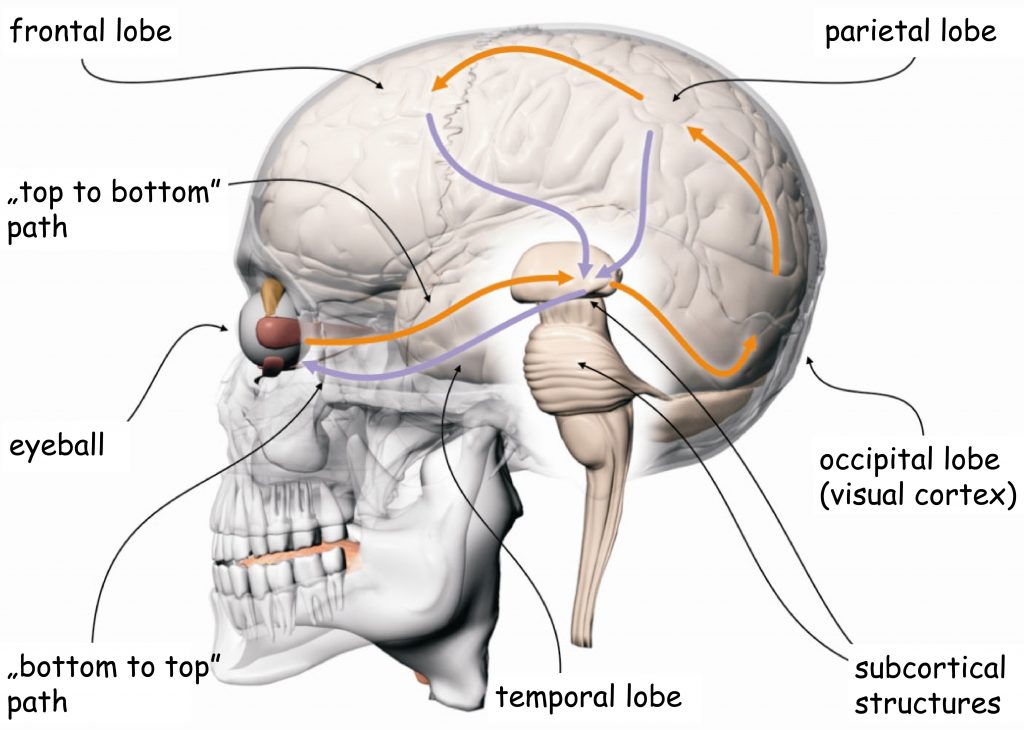
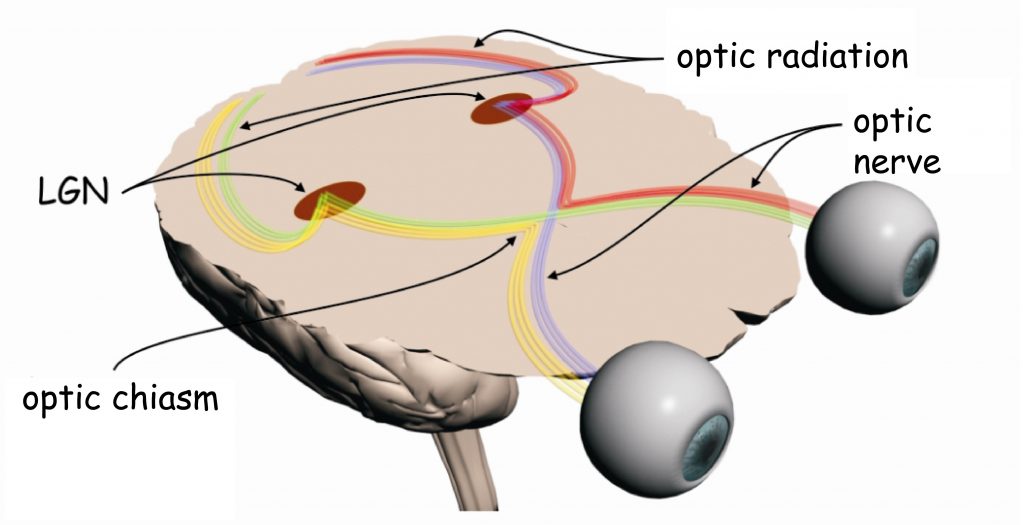
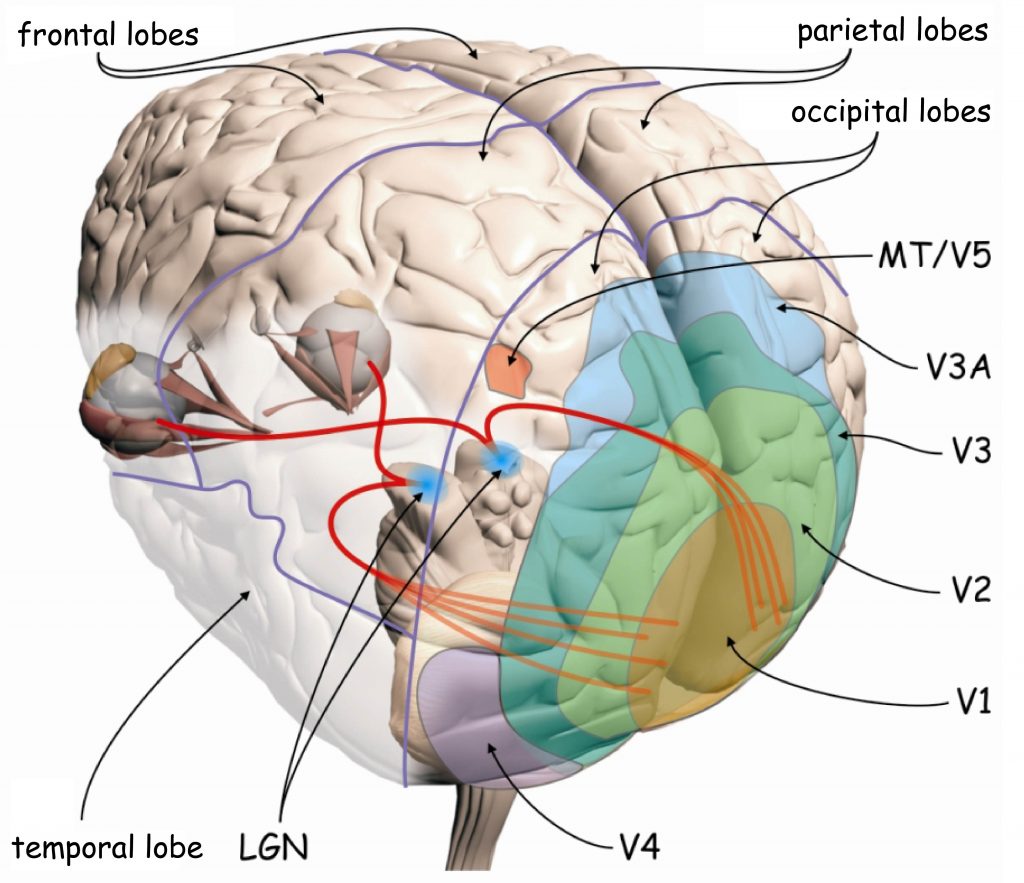
Brain processes underlying the experience of seeing are conducted by neural networks, which form the so-called visual pathway. It is a functionally and anatomically complex biological structure which, to put it very simply, consists of three modules. The first module is eyes, more precisely their optical systems and retinas. The second module consists of all subcortical structures located between the eyes and the cerebral cortex, particularly in the occipital lobe. And the third module — most complicated and least known, yet, as it seems, most important for seeing — consists of interconnected cortical areas in various brain lobes (Fig. 4).
The division of the visual pathway into three parts results from the roughly described functions performed by the structures located in each of them. The first module — the eyes — is responsible for recording the light and the initial organization of the sensory data. In the second module, these data are ordered and categorized. Both these parts form the so-called early stage of the visual pathway. In the third module, most complicated in terms of function and structure, the sensory data are analyzed, and then integrated and synthesized. The cooperating brain structures which form this block are referred to as higher or late stages of sensory data processing. The final effect of the work of all these modules is the subjective experience of seeing.
Top-down and bottom-up processes
The direction of the flow of neural impulses in the visual pathway was depicted in Fig. 4 with arrows. The orange arrows, which indicate the order from the eyes through the subcortical structures into the cerebral cortex, represent the so-called bottom-up processes of sensory data processing. Following this direction of the sensory data flow, the lobes of the cerebral cortex receive data on the distribution of light reaching the eyes of the observer within the scope in which the photoreceptors record them, and the neurons connected to the photoreceptors — forward them. It means that if a part of a visual scene is, for example, brighter than another, the receptors which are more intensively illuminated will react more strongly, proportionately to its brightness. Such information will be sent to the top, towards the center, namely towards various parts of the cerebral cortex.
It could seem that when we are talking about visual perception, the bottom-top direction of sensory data processing is the only possible way of getting to know the world with our vision. The eyes, like a camera, record the light, and the brain interprets its distribution, creating the content of the subjective experience of seeing. As a result, the observer knows what is in front of their eyes—nothing further from the truth. The everyday experience provides thousands of examples that contradict the principle of mechanical video recording using eye-cameras. It does not mean, however, that there are no similarities between the eyes and the automated means of image recording. But there is one fundamental difference — cameras do not think about the world they record. All they can do is indicated that there is, for example, a human face in the frame. They have no idea, however, to whom it belongs and what relationship we have with its owner.
Even though the scope of human binocular vision in the horizontal plane is approximately 180°, and in the vertical plane — about 130°, we do not perceive all objects in the area with the same clarity. Moreover, we may not notice the presence of some objects at all if they are atypical or insignificant from the perspective of the task being carried at the moment. We may, for example, overlook a gorilla, strolling the basketball court between the players passing the ball to each other, when we concentrate on counting the passes (Simons and Chabis, 1999). These properties of the visual systems were intuitively used by the masters of cinematography, first and foremost, Alfred Hitchcock.
We can also erroneously presume the presence of some objects in a visual scene only because we have frequently seen them in similar situations. We can, for example, be sure that we have seen a light switch on the wall next to the door, even though it was not there. To put it briefly, the brain actively processes the sensory data and assesses their usefulness in terms of the currently performed task. This process may as well result in ignoring quite large groups of sensory data or, on the contrary, stimulating the muscles coordinating the eyeball movement to relocate vision from one part of a scene to another to obtain new data. All these processes are generally called top-down processes. In Fig. 4, the direction was marked with purple arrows pointing downwards.
The top-down processes manage sensory data processing, meaning that they filter the data based on the type of the currently performed task, the intention, the need, the attitude, the beliefs, knowledge, or expectations of an observer. Their results affect the movement of eyeballs, direct the visual axes on those elements of the painting that require more in-depth analysis. Comprehensive experimental studies regarding the role of attitude understood as generalized preparedness to a specific form of response, also in terms of visual perception, were carried out as early as in the 1960s by Dimitri Uznadze’s students as a part of the so-called Georgian school of psychology (Bżaława, 1970; Prangiszwili, 1969; Uznadze, 1966).
In general, the subjective visual experience is a result of sensory data processing via processes which organize data from bottom to top and “push” them towards higher levels of the brain and top-down processes that filter and modify these data depending on current needs, beliefs, or knowledge of the observer as well as have a top-down effect on the framing of other elements of a visual scene.
Content analysis and visual scene framing systems
In Fig. 4 many different brain structures, which participate in sensory data processing in early and late stages of the visual pathway, are highlighted. These structures are connected with one another in a non-accidental manner as are the transistors on the radio’s circuit board. Particular brain structures (called nuclei, areas, lobules, sulci, gyri etc.) are connected with one another through axons of neurons, i.e. the cords through which nerve impulses travel from one cell body to another. There are structures in this biological system which not only transmit nerve impulses to other structures but also directly or indirectly receive feedback from other structures. Moreover, within different brain structures there are also complicated connections between the neurons that create those structures. The network of all these connections is really complicated. However, on the basis of functions performed by different networks of cooperating neuron clusters that take part in visual data processing, two main systems can be distinguished. Those are: framing system and visual scene content analysis system.
Every vision experience incorporates only a fragment of a larger whole. We see as if in frames. We cannot simultaneously see everything that is happening around our heads. Viewing something is therefore a sequence of frames — the views of things, limited by the field of vision. In order to see the elements of the scene that are out of view, it is necessary to change the location from where the scene is currently viewed or, while remaining in the same location, the position of eyes or head needs to change. This function is performed by the neural visual scene framing system which controls the movement of eyeballs (as well as the movement of the head and the whole body), fixating the visual axes in the most interesting parts of the visual scene.
As one might imagine, the difference between viewing any visual scene and viewing a picture is that regardless of the natural limitations of the field of vision, the picture also has its boundaries. In the case of museum paintings, the boundaries are defined by frames that separate the work’s painted surface from the wall. The frames of the image could just as well be the edges of a cinema screen, television screen, computer screen, the outline of a photo in a newspaper as well as a theatre curtain or, even more conventional yet also existing, the boundaries within which a play in an urban space or a performance hall takes place. Viewing an image requires ignoring anything that lies beyond its boundaries, especially when the natural field of vision also covers that space. The color or texture of the wall where the painting is hung are not a part of the image. Therefore, viewing an image requires, above all, respect for the spatial boundaries the image imposes. Viewing an image and seeing that image in a space such as a museum are qualitatively two completely different acts of vision.
The second important feature of vision is that the frame designated by the field of vision or the frames of the image always has certain meaning. It consists of the elements making up the scene, colors, background, spatial composition, movement. Understanding of a visual scene requires that its features be analysed and confronted with existing knowledge and visual experience. It is implemented through the neural system of image content analysis. The basic function of this system is to lead to a subjective vision experience, although it does not necessarily need to be equivalent to the understanding of what is currently seen.
Many people who had the opportunity to see the over four-meter-long painting by Mark Rothko for the first time (Fig. 5) ask themselves what it is all about, or, more radically, why it is even considered to be a work of art. Lack of knowledge, often not just visual, may constitute a serious limitation to the level and depth of image understanding. Nonetheless, regardless of whether one accurately understands what they see in an image, it is certain that the neural system which analyses the content of a visual scene always tries to attribute meaning to what is being seen.

While dividing the visual systems into the framing system and the content analysis system, it is worth adding that both of them operate in the bottom-top and top-down mode of sensory data processing. On the one hand, almost every scene has elements that draw attention more, and, by stimulating the visual scene framing system, they activate the system of analysis of its content in the mode of distanced processing. On the other hand, the same scene may be subjected to a specific analysis, and can be framed depending the task that is being performed at the time by the observer, which is carried out in the top-down mode of sensory data processing.
IMAGE CONTENT ANALYSIS SYSTEM
Visual scene features
A minimum condition for subjective experience of seeing is recording (observation) of shape of a flat (two-dimensional) figure or a three-dimensional object in the space encompassed by the observer’s field of vision. I am not determining at this point whether we initially see objects in two or three dimensions, because it is a dispute that is yet to be resolved (for example Marr, 1982; Pizlo, 2008). However, regardless of that, the shape may well be simple — for example, a point or an outline of a geometric shape — or complex — for example a car driving by.
In the natural conditions we extremely rarely encounter situations in which we do not see any shape in our field of vision, namely things that reveal their distinctiveness by bordering with something else. Dense, total darkness or thick fog may lead us to believe that we cannot see anything. The “anything” simply means lack of the presence of any shape. A shape is a basic definitional quality of each figure or object and their parts as well as a feature of the background and space in which they exist, namely a definitional of every visual scene (Bagiński and Francuz, 2007; Francuz and Bagiński, 2007). The shapes of the things seen are the most important criterion in their categorisation (Francuz, 1990), and constitute the basis for knowledge on what the world looks like. They can determine the boundaries of both named and unnamed objects.
The experience of absence of any shapes in one’s field of vision is quite rare in the natural conditions. The contemporary art, on the other hand, provides a number of model examples of images that present the recipient with such experience.
In 1951, Robert Rauschenberg exhibited a series of provocative paintings titled White Paintings in which nothing whatsoever was painted (Fig. 6). Even the edges of the paintings were marked only by the shadows cast on the wall by stretchers.

White Paintings by Rauschenberg reveal two subtle boundaries; the first one — between seeing the scenery that a painting is a part of and looking at a painting, and the second — between the bottom-up and the top-down process of sensory data processing. On the one hand, the painting in Fig. 6 does not contain any meaning, yet the meaning of the visual scenery in which it is present is constituted by three, rectangular canvas painted white. On the other hand, the paintings provoke the minds of their recipients to fill them with any meaning precisely because of that fact. Similar conclusion in terms of music were drawn by Rauschenberg’s friend, John Cage, who in 1952 composed and performed the famous piece, “4.33” for symphony orchestra. During its performance, no musical instruments produced any sounds. Shapes as well as sounds in musical pieces, are, therefore, categories which refer to both what is registered by the senses (eyes or ears), and what is produced by the minds of observers or listeners.
The second property of every visual scene is the color, namely a specific sensory quality of a figure or object determined by its shape or background. Color can be described using three dimensions: hue, namely the attribute that we usually understand as red or blue color, lightness (or brightness, value), also known as the luminance or color value, characterising color brightness in a continuum between black and white, and saturation (or chroma) namely something that we experience as color intensity. Sometimes gloss, which is a derivative of the surface type or of a material covered with color, is also added to the list. The observed differences between the planes of the painting in terms of brightness (luminance) and hue are important tips regarding the shapes of figures or objects present in a visual scenery. Apart form the listed sensory properties, colors are also attributed with various symbolic values that can modify the meanings of the things we see (Gage, 2010; Popek, 2012; Zieliński, 2008).
The third characteristic of a visual scenery is its spatial organisation in two dimensions or more. If noticing at least one shape that suggests the presence of an object and separates it from the background is a constitutive feature of the scenery, then the object must naturally be located in a given place in the space. Referring to the notion of a place in a visual scenery makes one aware of the fact that it is a representation of some point of view, and that it is limited by the range of the observer’s field of vision, or the frames of the painting.
Determinations of object location such as, for example, “on the right” or “on the left, “higher” or “lower”, “closer” or further” both from the observer and from one another, are always relative to the point from which the given composition is seen, and the framework. It is concerns both whole visual scenes and paintings to the same extent. The importance of the observer’s position in relation to the scene that they see is so paramount that one can even speak about their egocentric position in the world of the object seen (Goodale and Milner, 2008). Such favouritism results from thee fact that the observers sees not only objects of a scene, but also relations between them. Relations between objects in a visual scene and on a painting, observed on a plane perpendicular to the visual axis, are intuitively established in relation to the sides of the observer’s body and to the natural frames outlined by their field of vision as well as the frames of the painting. On the other hand, noticing relations between objects along the lines parallel to the visual axis, that is inwards the painting, is not quite so obvious and requires application of special procedures of retinal data processing as well as knowledge on depth indicators, in order to grasp them.
The fourth and the last characteristic of a visual scene is its dynamic. It is a derivative of the velocity, variability, acceleration and movement trajectory of both objects within the visual scene and the observer. Movement of objects within the visual scene destabilises the spatial relations between them. In addition, an observer can change their location in relation to the given scene, thus changing the point from which it is viewed. This concerns not only relocation of the observer in space (for example during window shopping while taking a walk), but also the movement of their eyes, which causes the visual axis to shift from one fragment of the scene to the other. To put it shortly, the movement of objects in the visual scene as well as the movement of the observer while looking at it constitute a huge complication in the analysis of subjective experience of seeing. As stated earlier, the issue of movement within an image, namely within its frames is not the subject of this book, but the movement of the observer, in particular their eyeballs while looking at the image, is.
The listed four features of the visual scene — the shape, the color, the spatial organisation and the dynamics — can be divided into two categories, even thought these categories are not separable. The first one are those properties of the scene that allow the observer to recognise the objects present in it and notice something about their forms and colors. It is the category of objects. Perceptive analysis of the specimens that belong to this category usually does not depend on neither their position in relation to the observer, nor whether they are still or in motion.
On the other hand, spatial organisation and object movement in the visual scene are almost always related to something about which we can say that it has some shape and color. Noticing an object as being located, for example, on the right side of the visual scene results from its location in relation to the observer’s body. These features, however, are not only clearly related to the observer’s body representation, but also to their movement. In general, spatial organisation and object movement in the visual scene create the category of relations.
All the listed categories of visual scene features are not separable, because there are such visual experiences that are located at their interface. A very fast moving object or observer, through a complete blurring of the edges or even colors of things in the visual scene, may trigger the experience of seeing movement that is not a movement of an object of a certain shape. Due to the high speed at which the observer can move, as well as the ability to create images through electronic media, the number of such experiences is constantly increasing. So far, evolution has not developed efficient mechanisms for dealing with such situations. The best manifestation of this are the unexplained mechanisms of many optical illusions in the field of motion perception, created using digital visualisation techniques (see e.g. Michael Bach’s website, Optical Illusions & Visual Phenomena), as well as the illusions, e.g. jet pilots have (Bednarek, 2011).
Vision as an act of creation
David Hubel (Nobel laureate in the field of physiology and medicine in 1981) and Margaret Livingstone’s article, published in 1988 in Science, contains an excellent introduction to the problems concerning the functioning of the neural system of analysing the content of visual scene. Although a quarter of a century has passed since its release, and the research results in the field of cognitive neuroscience have verified most of its hypotheses regarding the processing of visual data, it is still an up-to-date and reliable source of information on the structure and function of individual components of the visual pathway.
The basic finding regarding the function of the visual pathway in the formation of a subjective vision experience is that, starting with the retina’s neurons found in both eyes of the observer and ending with various structures of their brain, the above-mentioned characteristics of the visual scene (such as shape, color, two- and three-dimensional spatial orientation and motion) are analysed by four neural pathways (subsystems), partly independent of one another. This statement is fundamental to understanding how the experience of seeing the scene and the objects inside it, is produced. It shows that data, recorded by photoreceptors, on the distribution of light entering the eye at a given time, are subject to partially independent analyses, conducted by four specialised nervous subsystems, for the most part of the visual pathway. The purpose of their activity is to interpret this data based on the characteristics of the objects and/or their fragments, which are currently in the observer’s field of vision on the basis of their visual experience.
The experience of seeing a complete visual scene is not the result of a simple image reflection projected on the eye’s retina (as, for example, in camera obscura), but takes place in two main phases: (1) decomposition, consisting in the analytical and relatively independent study of the listed features of the visual scene, after abstracting them from the retinal image; and (2) composition, i.e. integrating (synthesising) the results of the analyses conducted in the first phase, taking into account data previously recorded in visual memory.
The presence of both of these phases in each act of vision leads to the conclusion that the result of sensory integration always (to a greater or lesser extent) differs from the recorded source data. This means that the visual experience’s content is constantly produced by the visual system rather than – as it might seem – reproduced from retinal images. In this sense, vision is an act of creation, during which the image of reality recorded by the system of photoreceptors found in the eye’s retina of the observer is constructed.
Early analysis system of visual scene content
The photoreceptors located in the retina inside the eye record the distribution of entering light. This is the first stage of the visual scene content analysis procedure. The most important neural structures that are involved in the recording and arrangement of sensory data in the early stages of the visual pathway are shown in Fig. 7.
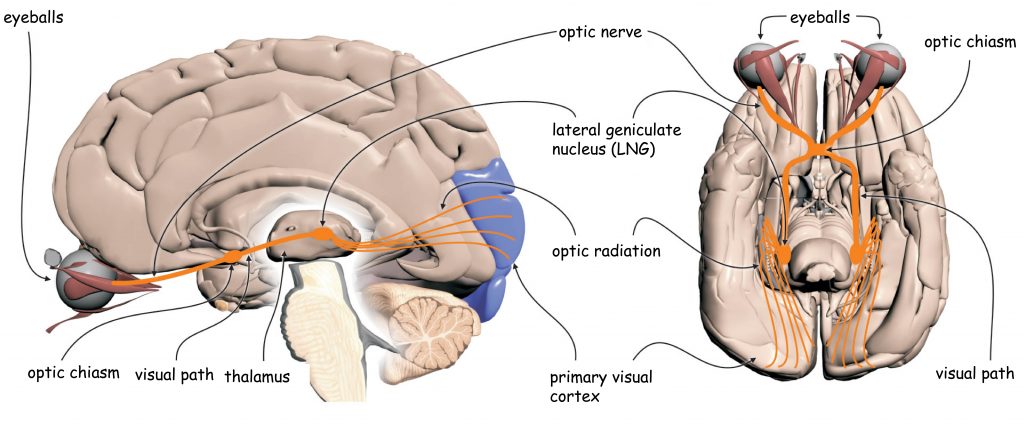
The early analysis system of visual scene content essentially consists of two separate structures: the eye, in particular the optical system (i.e. the lens that is in its front part and the retina located on its back wall inside the eye) and the lateral geniculate nucleus (LGN), placed halfway between the eyes and the cerebral cortex, in a place called the thalamus.
In the retinas of the eye there are, among others, so-called ganglion cells. Their axons (projections) over which, like a telephone wire, nerve signals are transmitted into the brain, form an optic nerve. In the area between the eyes and LGN there is an optic chiasm – a place where a bundle of axons carrying nerve signals from each eye splits into two parts. A half of the axons from the left eye connect with a half of the axons from the right eye (similarly, the other half of the ganglion cells axons exiting the both eyes) and continue their pathway together to enter the right and left brain’s hemispheres. The area between the optic chiasm and LGN is called the optic tract.
Together with LGN, nerve impulses are transmitted to the so-called primary visual cortex or striate cortex in the occipital lobe of the brain via the axons of a large group of cells, whose bodies are found in LGN. This area is called optic radiation and broadly closes the first stage of sensory data transmission and sensory data processing in the visual pathway.
Eye – the camera metaphor
In many ways, the structure of the eye and the camera are similar. Before pointing out the main differences between them, it is worth to have a closer look at this analogy (Fig. 8).
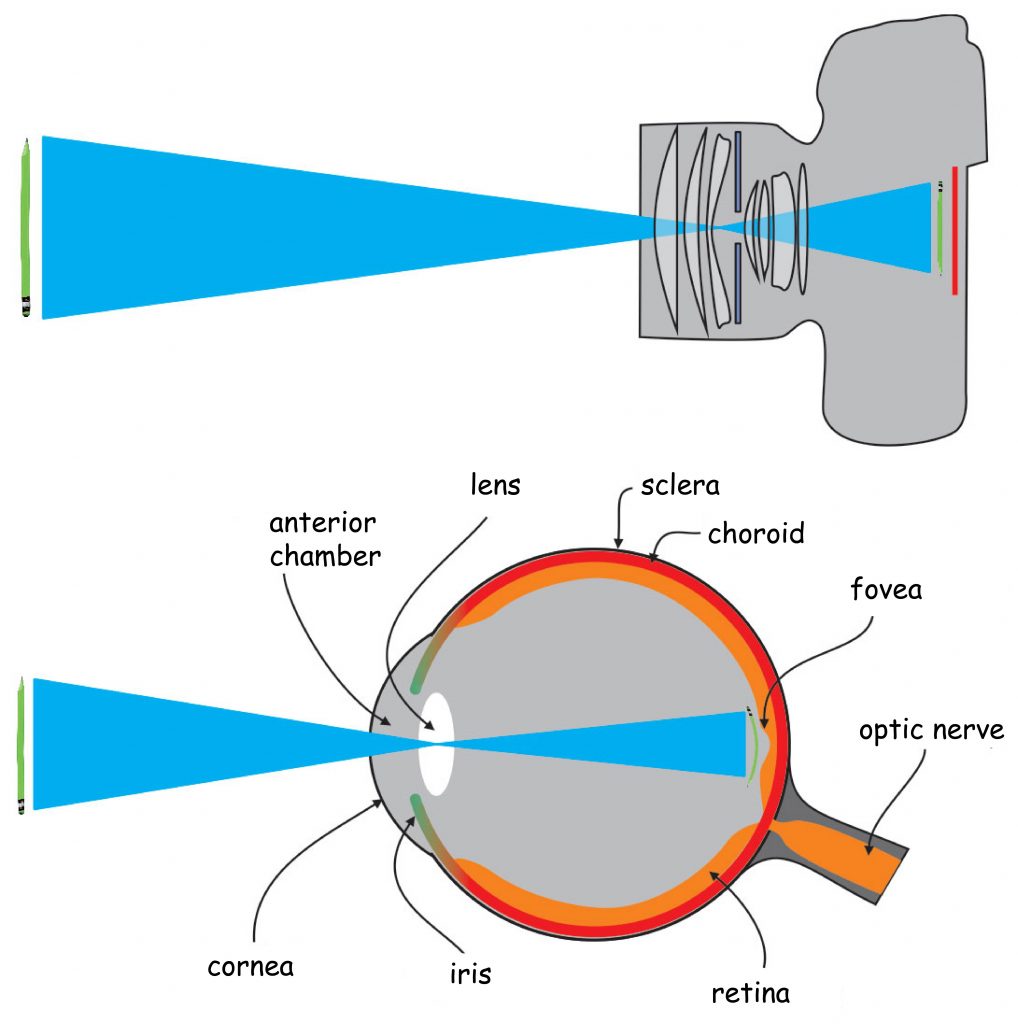
The visual pathway begins in the eye. Like the camera, the eye is made up of a hermetic and rigid body. In the eye, it is called sclera. It protects the eyeball against mechanical damage and to stabilise its shape.
The front of the eye has an optical system, i.e. the biological equivalent of a camera lens. The most outer element is the transparent cornea, which, like the sclera, protects the eye from the mechanical damage. It also acts as a sort of protective filter and fixed focal length lens. Just behind the cornea is a pin-hole visible for the lens, called the pupil, whose diameter is adjusted by means of the aperture, i.e. iris.
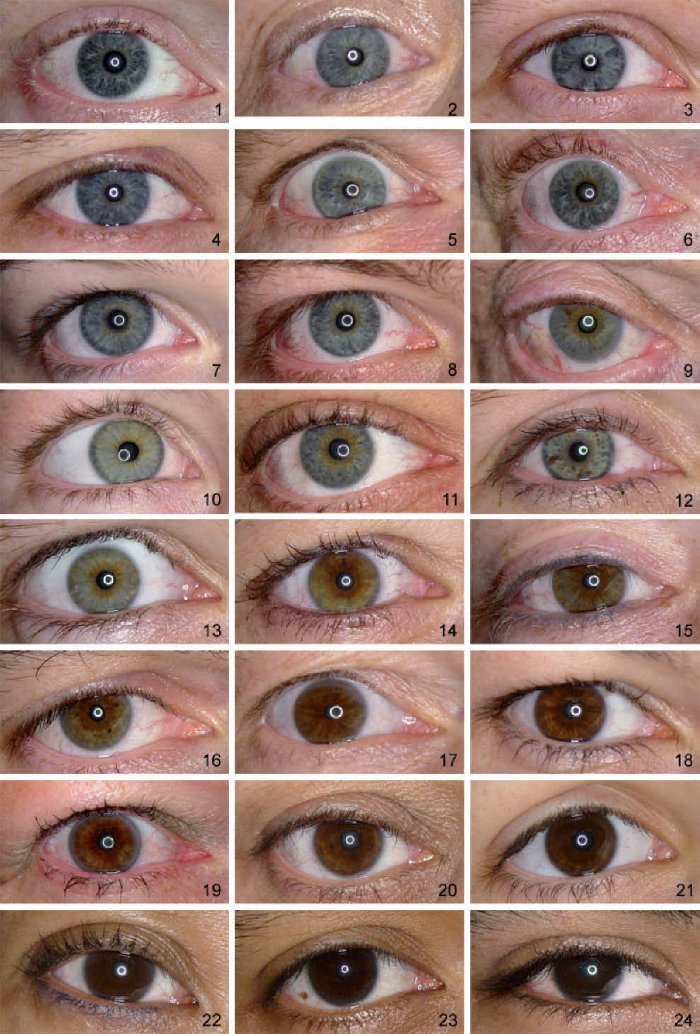
Incidentally, unlike the aperture on the camera, the iris is colorful: most often brown (in various shades), but it can also be grey, green or blue (Fig. 8.1).
Behind the iris, one of the most extraordinary organs in our body is placed a varifocal lens. Ralf Dahm (2007) calls it a “biological crystal”. The eye’s lens has two properties distinguishing it from the optical system in the camera. Firstly, it has excellent transparency, allowing transmitting almost 100% of light to the inside of the eye, provided that it is fully working. The eye’s lens is also varifocal, which enables the observer to see objects clearly at different distances from it. The mechanism of changing the focal length of the eye lens is nothing like the focal length change in the camera lens.
Maintaining visual acuity for objects at different distances from the optical system of the eye is ensured by the ability to change the shape of the eye lens. The closer the object is to the observer’s eye, the thicker the lens becomes. The further the object is to the observer’s eye the thinner it is (Fig. 9).
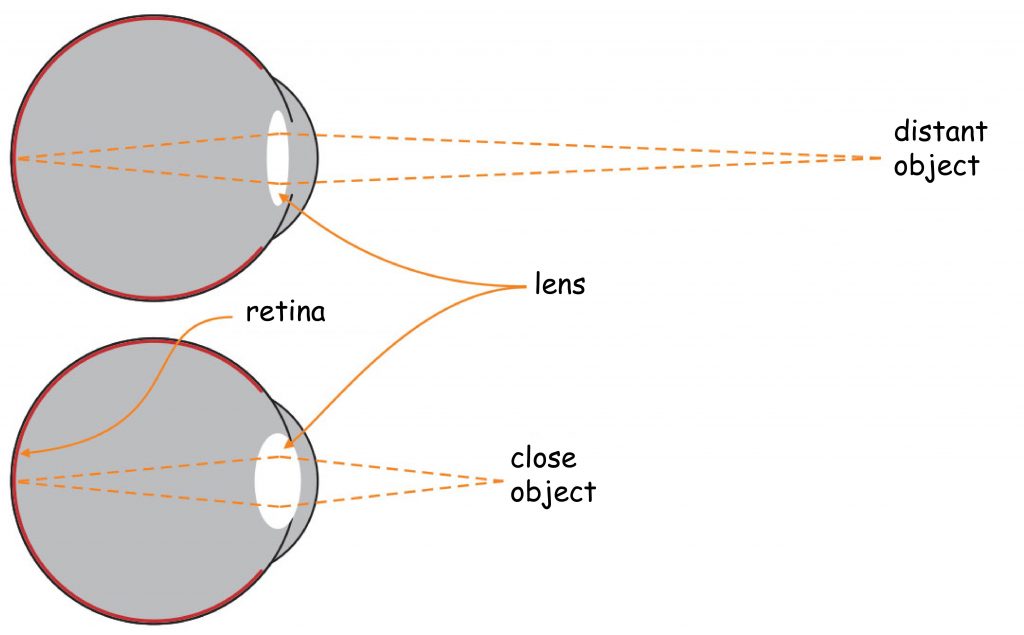
The lens is attached to the inner part of the eyeball with ciliary muscles. They stretch the lens as they contract, making it thinner, while they make the lens swell in its inner part as they become relaxed. The effect of focusing light rays on the back wall of the eyeball is associated with the change in the angle of refraction of light rays on the lens according to its thickness. A thicker lens bends light rays at a larger angle than a thinner one. This phenomenon is called eye accommodation.
On the opposite wall of the eye’s optical system, a photosensitive matrix, i.e. retina, is found. It covers about 70% of the inner surface of the eyeball. The light reflected by objects in the visual scene or emitted by them illuminates the bottom of the eye and creates its retina projection. It is characterised by the fact that it is: spherical, smaller and turned upside down in relation to the original (provided that we know what the original looks like). Nevertheless, such distortion are not a major problem for the brain.
If the observer has a fully functional optical system, the whole image of the visual scene is projected onto the retina’s surface with very high accuracy. This image is sharp and clear. Unfortunately, this does not mean that the retina reflects it in every place with the same quality on which it is projected. Due to the way in which the distribution of light reaching the retina is analysed, it can be compared to a heavily damaged cinema screen, which in many places is undulating, unclean, and even pitted in some places. To put it briefly, although the eye and the camera have many common features regarding their structure, their functioning is almost completely different (Duchowski, 2007). The sensors in the camera’s matrix will record each light parameter with the same quality, on the contrary to photoreceptors in the retina.
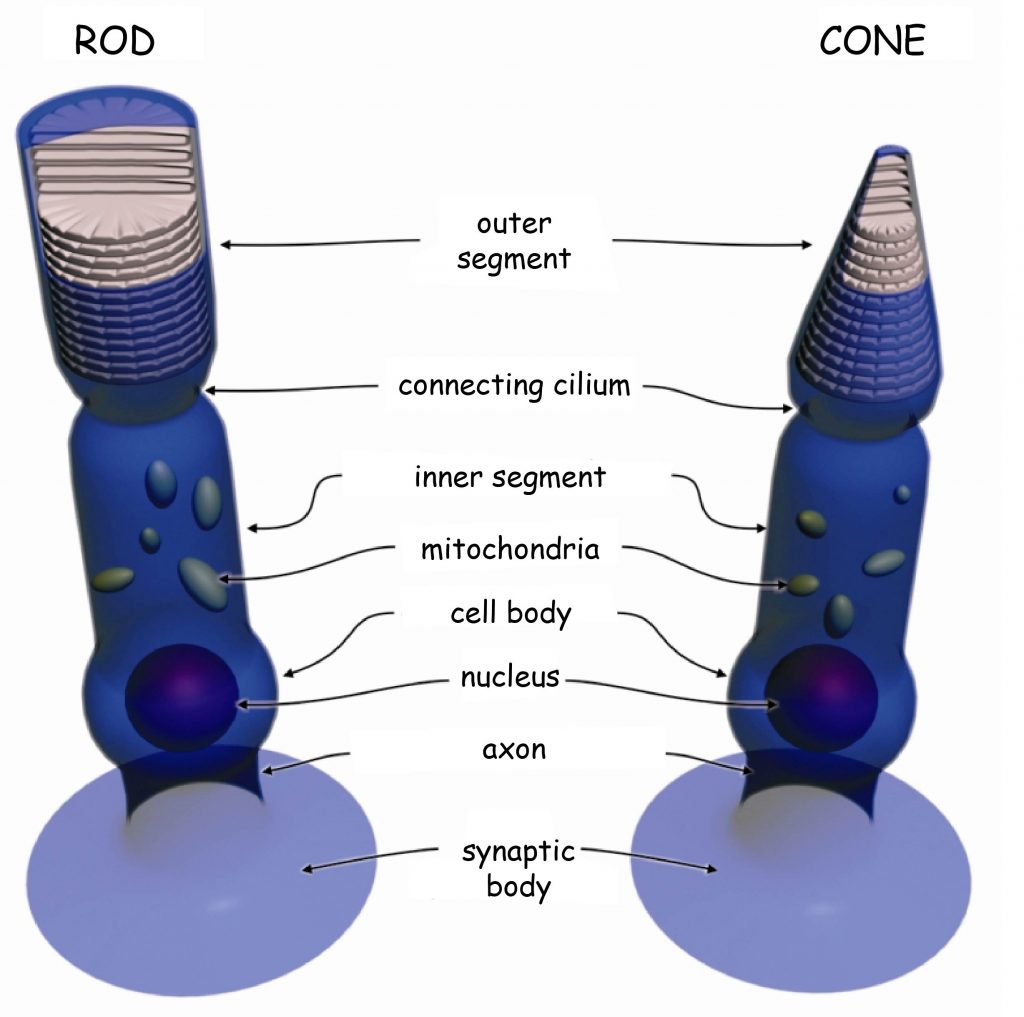
There are two types of photoreceptors in the retina, i.e. photosensitive cells. They are: cones and rods. The names of these receptors originate from their shapes: cones resemble tapers and rods – cylinders (Fig. 10). The rods are incomparably more sensitive to light entering the eye than the cones, which is why the cones work during the day and “fall asleep” at night, adapted to the dark. On the contrary to the cones, the rods “sleep” during the day, adapted to the light, and are active at night (Młodkowski, 1998).
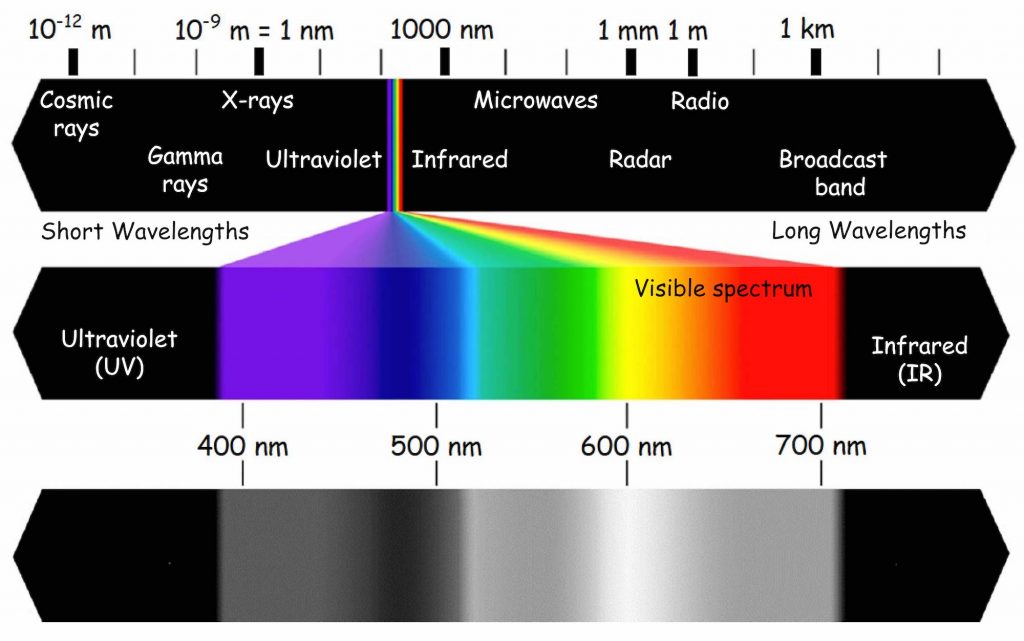
The cones react differently to various electromagnetic wavelengths in the visible light range, i.e. approximately from 400 to 700 nanometers. There is a close relationship between electromagnetic wavelength and color vision (Fig. 11). The cones also react to the intensity of the light wave. The rods, in turn, do not differentiate colors, but are particularly sensitive to the brightness (intensity) of light. The image reflected by the rods is achromatic. This means that when it gets dark and the rods acquire control over vision, we stop differentiating colors while still differentiating shades of grey. Obviously, this rule applies only to the colors that cover the surfaces on which the light is reflected, not those that emit it. At night, we see colorful neon lights, because the light they emit stimulates the cones. However, we cannot see the difference between the green and red paintwork of two adjacent cars in a dark street, because they reflect more or less the same light in low light conditions and the rods will react to them in a similar manner.
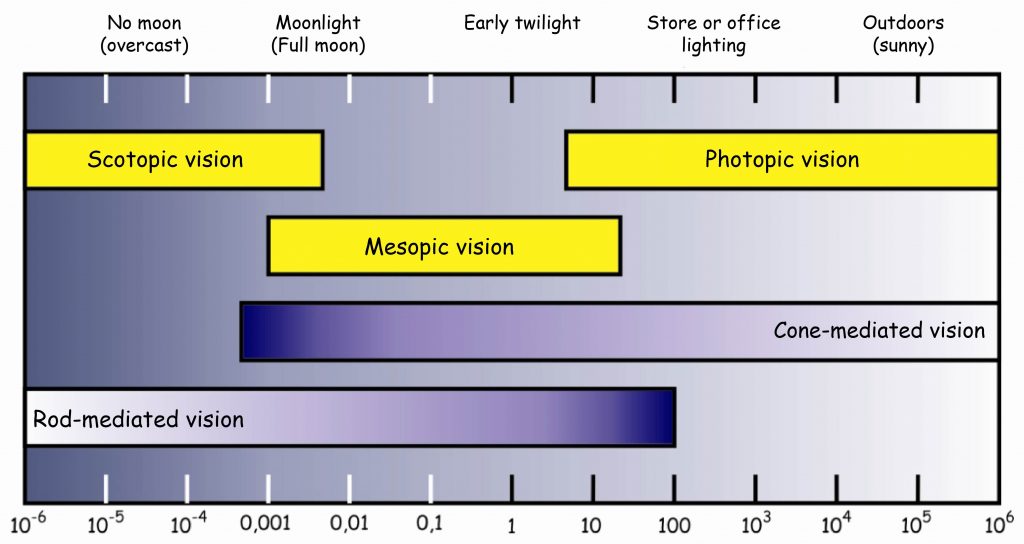
The vision under very good lighting conditions is called photopic vision and the cones primarily participate in it, whereas the vision in low light conditions is called scotopic vision and it is the result of rod activity.
Both types of photoreceptors work at twilight, early in the morning or in a moonlit night. The darker it is, the weaker the reaction of the cones becomes, and the rods awaken from the daytime slumber and react increasingly intensely. On the other hand, the brighter it gets, the more intensely the cones react to the light, whereas the reaction of the rods decreases. At this point, we are dealing with the so-called mesopic vision (Fig. 12). It is a time that is particularly dangerous for drivers, due to the fact that neither of the retina systems is 100% functional then. Brightness, which conditions activation of certain vision systems, is expressed using units known as candelas per square meter. Without going into details, one candela corresponds, more or less, to the light at twilight, right after the sunset.
Seeing images is possible primarily thanks to the cones which are responsible for seeing in good light conditions, and for this reason we will take a particularly careful look at them.
Distribution of cones within the retina
There are approximately 4.6 million cones in the retina of an adult person (Curcio, Sloan, Kalina and Hendrickson, 1990). Their largest cluster is located in the spot where the retina is crossed by the visual axis. Its other end, on the other hand, crosses the spot on which we focus our eyes. The visual axis is inclined at approximately 5° to the optic axis of the eye, running through the middles of all elements of the optical system of the eye, namely the cornea, the pupil and the lens (Fig. 13).
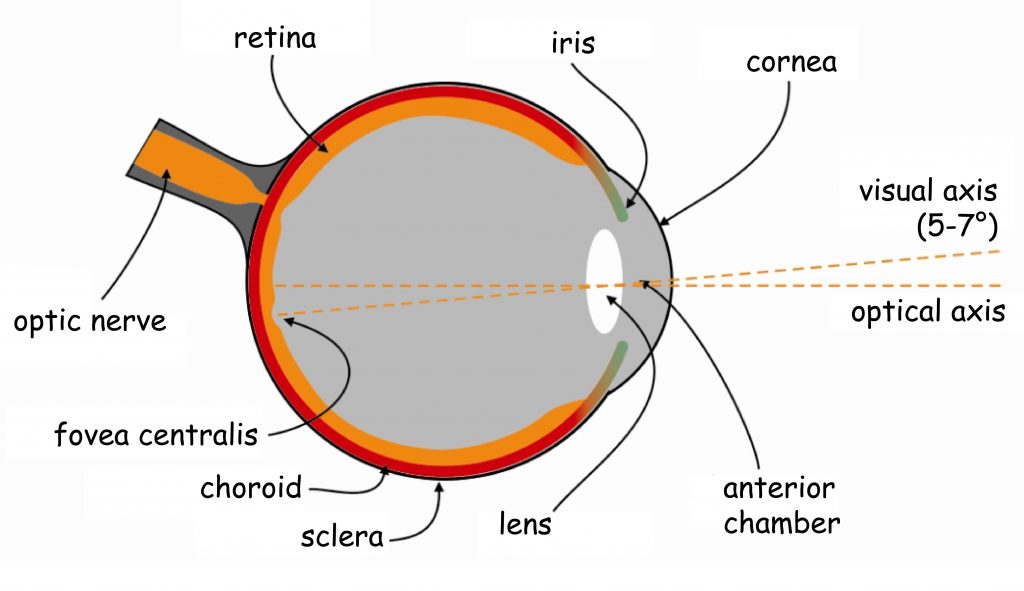
The intersection of the visual axis and the retina is a small elliptical area with chords of approx. 1.5 mm vertically and 2 mm horizontally and with a surface area of approx. 2.4 mm2 (Niżankowska, 2000). This area is called the macula and there are over half a million cones packed there, i.e. over 200 thousand /mm2. For comparison, there are only 3–4 pixels on a 1 mm2 LCD screen with a resolution of 1920 x 1200. That’s 50 thousand times less than in the central part of the eye!
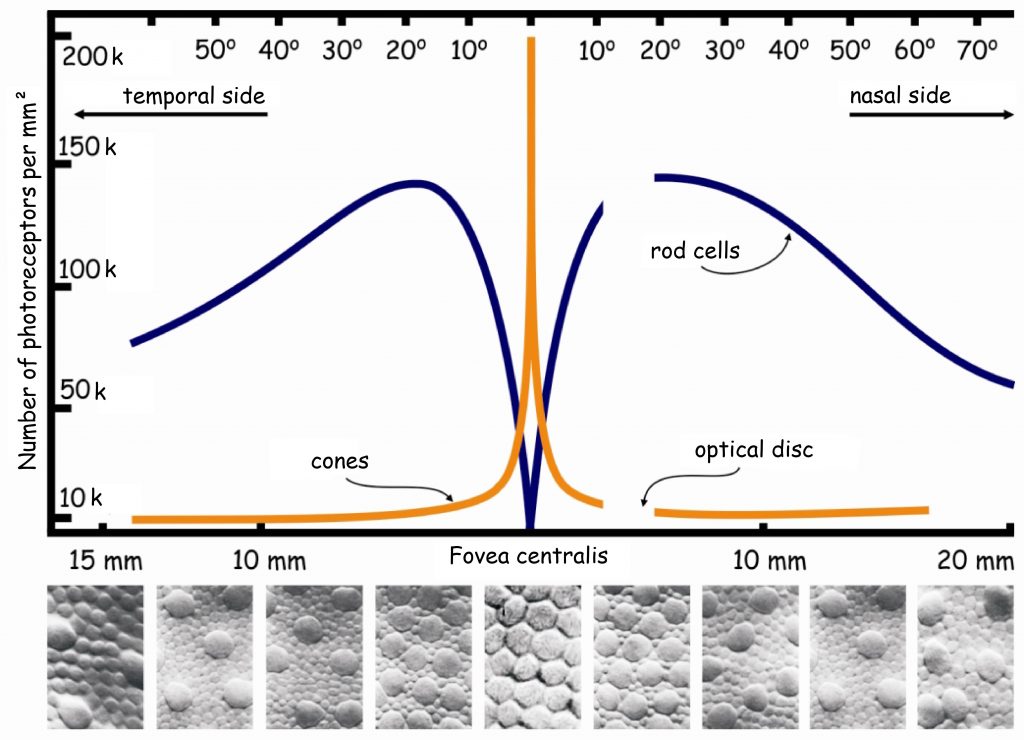
Inside the macula, there is an even smaller area of approximately 1 mm², known as the fovea. Inside, in the foveola, the number of cones can reach up to 324 thousand /mm2. In adults, there are about 199,000/mm2 of them in this area (Curcio et al., 1990), and the further away from the fovea, there are less of them (Fig. 14).
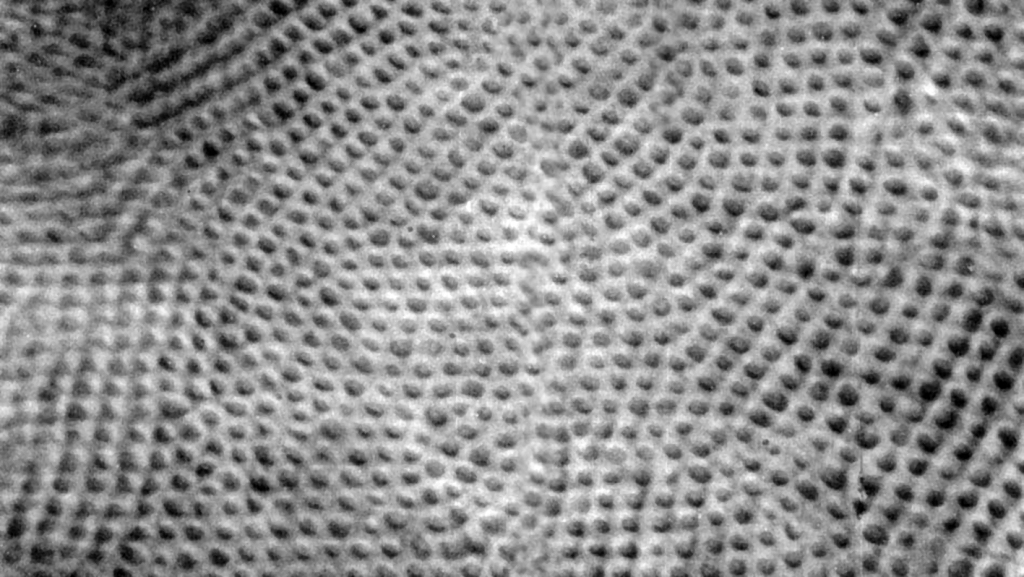
If it were possible to use cones from around the middle of the fovea to build a small image matrix of 36 x 24 mm for a digital camera, its resolution would be not 12 or even 30 megapixels, but approx. 280 Mpix! The accuracy of the image recorded by cells located within the area of the fovea is unimaginably high. In Fig. 15, one can see the retina’s surface near the center of the fovea, with visible cones in the shape of blobs (Ahnelt, Kolb and Pflug, 1987). This is approximately how the surface of the entire retina-screen, on which the image opposite the eye is projected, looks like. In different areas, there may be only a slightly different density of photoreceptors. What the brain learns about the world through the eyes is directly related to the activity of these small-screen points.
The surface of the fovea constitutes only 0.1% of the entire surface of the retina, while the surface of the macula — 0.3% (Młodkowski, 1998). There are no rods in there, and the cones located in the area constitute 1/8 of all cones in the retina. The remaining 4–5 million cones are distributed on 99.7% of the retina surface around the macula. It means that there are approx. 7 thousand of them per 1 mm² of the retina, beyond the macula (Hofer, Carroll and Williams, 2009). This is still quite a lot, but there are almost thirty times fewer cones on most of the retina than in the fovea.
As it is easy to guess, the direct consequence of the described distribution of photoreceptors on the retina is that depending on the place of its lighting, the projected image is processed with a different spatial resolution. In other words, the brain derives much more data that allow it to more clearly reconstruct the image of the visual scene from sites with a higher density of photoreceptors, than on the basis of data from those areas of the retina that are poorer in photoreceptors.
A few words about rods
As has already been highlighted, in addition to the cones, there are other photoreceptors, i.e. rods, in the retina of the human eye. Their number ranges from 78 to 107 million depending on the person (on average around 92 million). There are therefore 20 times more rods than cones (Curcio et al., 1990). This means that the retina is much less “hardware” equipped to see the world in colors under full lighting than in a monochrome way and in the dark. It is probably a remnant of our predatory ancestors, who did not really care about seeing the world in colors and definitely preferred hunting at night rather than during the day. Well, we inherited color vision from our ape ancestors, who preferred to eat during the day, carefully looking at the color of a banana or mango peel. This was crucial, at least as regards indigestion.
There are no rods in the fovea and the first ones occur only in the regions of the macula. The further away from the macula, the more rods there are. The largest number of rods is located about 20° from the fovea and is comparable to the number of cones in the macula, i.e. approx. 150k /mm2 (Fig. 14). Moving further in the direction of the peripheral retina, the number of stamens gradually decreases and there are half as many stamens on the edges of the retina, i.e. approx. 75k/mm2.
Such a distribution of rods causes that in poor lighting conditions, we can see something relatively clearly not looking directly “out of the corner of the eye”, but more precisely, moving the centre of the optical system of the eye by approx. 20 angular degrees from the place we want to see precisely. Only then will the image projected on the retina be interpreted with the highest possible resolution.
Retinal hole
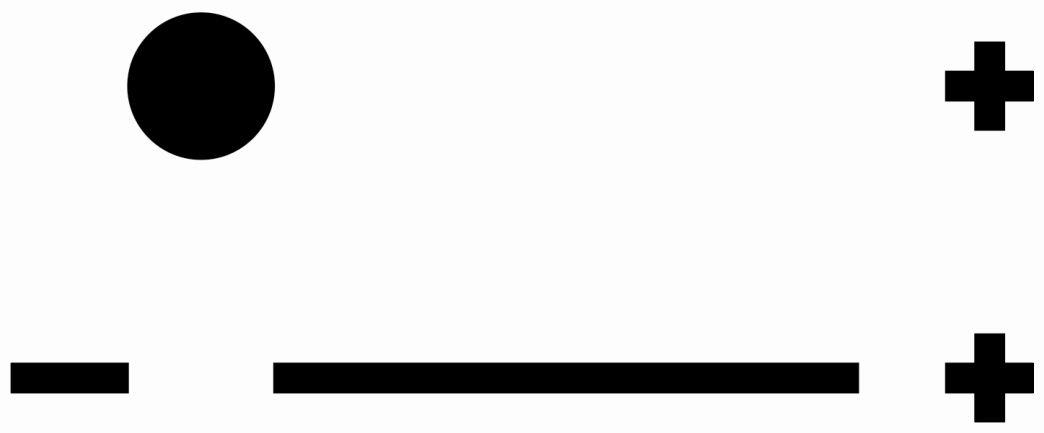
Finally, I would like to make a few more points concerning one structural detail of the retina. Approximately 15° away from the fovea, in the nasal retina of each eye, there is a literal “hole” with a diameter of 1.5 mm and a surface of approx. 1.2 mm2. This area is called the blind spot or the optic disc, and it contains no photoreceptors. It houses the optic nerve, which transmits signals concerning the state of photoreceptor stimulation to the brain, and blood vessels necessary for the oxygenation of cells inside the eye. In this area, the image projected onto the bottom of the eye hits emptiness. This is very easy to discover yourself. All you need to do is close your right eye and look at one of the crosses on the right-hand side of Picture 16 with your left eye, and then slowly approach and move away from it. At a certain angle, you will find that the circle located on the left-hand side becomes invisible, and the break in the line disappears. This occurs due to the fact that the image of the point or break in the line is projected onto the blind spot.
Specialized ganglion cells
The bottom-up analysis of visual scene content in the early stages of the visual pathway is possible thanks to the presence of not only photoreceptors but also different types of neurons in the retina of the observer’s eyes, of which the aforementioned ganglion cells play a particularly important role. They are specialized in the processing of data concerning (1) the wavelength of visible light, which is the basis for color vision, (2) the contrast of light brightness, which enables us to see, among other things, the edges of things or parts of things, i.e. shapes in general, (3) the variability of lighting in time, which is the basis for seeing movement, and (4) the spatial resolution, which lies at the root of the visual acuity.
Among the many types of ganglion cells, it is possible to identify those that are particularly sensitive, e.g. to the wavelength of visible light corresponding to green color. This means, more or less, that if these ganglion cells send nerve impulses towards the cerebral cortex, like in the Morse code, then the observer sees something green. When the cells responsible for movement detection are activated, the brain “learns” that something is changing before the eyes of the observer, although on the basis of this information it does not yet “know” whether it is moving in the visual scene, the observer is moving, or both. It will “find out” about it as well, however, by analysing data from other senses. Suffice it to say that seeing one property or another of a picture directly results from the condition of neural transducers and transmitters of sensory data. Damage to them may mean that a certain property of the painting may go unnoticed, as if it was not there.
Upon taking a closer look at the anatomy of ganglion cells it turns out they are essentially divided into three groups. The first group consists of midget ganglion cells, with small bodies and a relatively small number of branches, i.e. dendritic trees and an axon. The second group consists of parasol ganglion cells, with large bodies and a much greater number of branches (Fig. 17). The third group consists of bistratified ganglion cells, with tiny bodies and disproportionately large branches compared to their body size, though still considerably smaller than the branches of parasol ganglion cells or even midget ganglion cells (Dacey, 2000).
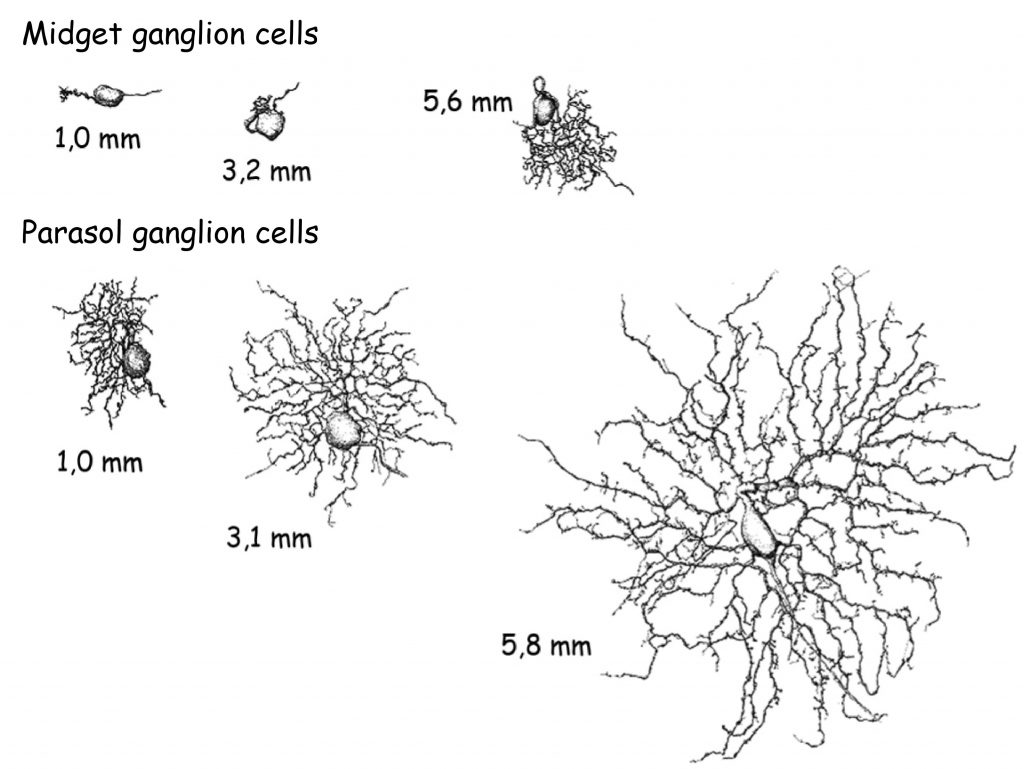
Although midget ganglion cells are smaller than parasol ganglion cells, their magnitude, and especially the number and spread of dendritic trees, which allow them to receive nerve impulses from other cells, depends on their distance from radial fossa. The closer they are to radial fossa, the smaller they both are.
Apart from dendrites, each neuron also has an axon, which is an offshoot that transmits nerve impulses from the body of a given cell to another. It is the axons of all three types of ganglion cells that make up a fundamental frame of an optic nerve. It consists of approximately 1 million (from 770 thousand to 1.7 million) axons of ganglion cells (Jonas, Schmidt, Müller-Bergh, Schlötzer-Schrehardt et al., 1992) and somewhat resembles an electrical cord made up of copper wires.
The number of axons of the three mentioned types of ganglion cells in an optic nerve is not the same. The majority, approximately 80%, are the axons of midget ganglion cells, and only approximately 10% are the axons of parasol and bistratified ganglion cells. The fibres of small cells (i.e. midget and bistratified ganglion cells) therefore consist of approximately 90% of all axons forming the optic nerve. It means that, for some reason, data transmitted by smaller ganglion cells are more important for the brain than data transmitted to it via larger (parasol) ganglion cells.
Ganglion cell bodies are located in the retina of the eye. Their dendrites receive data from photoreceptor via different cells, but those will be discussed later. In any case, due to a smaller number of dendrites, midget ganglion cell connect with a much smaller number of photoreceptors and other cells in the retina than parasol ganglion cells which have large dendritic trees. What is important, however, is that small ganglion cells (midget ganglion cells and bistratified ganglion cells) connect mainly with the photoreceptors located in the central part of the retina. They are therefore much more sensitive to the spatial resolution of the retina’s lighting than parasol ganglion cells. Thanks to midget ganglion cells we can very accurately differentiate between shapes of different objects. The only issue is that their greatest cluster covers a relatively small area of retina and as a result – a small field of vision.
Another property of small ganglion cells is their sensitivity to light wavelengths. More than 90% of them specialises in that field, originating the processes of vision and color differentiation. Almost all midget ganglion cells perfectly differentiate electromagnetic wavelengths corresponding to green and red colors, but they perform much worse when it comes to the opposition of yellow and blue. However, this task is performed by bistratified ganglion cells. They are the ones that play an essential role in the processing of data related to differentiation of yellow and blue colors (Dacey, 2000).
As opposed to small ganglion cells, parasol ganglion cells do not differentiate light wavelengths, but are much more sensitive to edge detection between planes of similar brightness than midget ganglion cells. They are able to register a 1–2 percent difference in the brightness of juxtaposed surfaces, and 10–15 percent differences in brightness are registered without any problem (Shapley, Kaplan and Soodak, 1981).
Midget ganglion cells require a much greater difference in the brightness of juxtaposed planes in order to register it. Moreover, parasol ganglion cells cover a much larger surface of the retina than midget ganglion cells. Both these properties of large ganglion cells perfectly complement the limitations of small cell in terms of edge detection of things in the observer’s field of vision outside fovea and in regards to spatial relations between them.
There is another important difference between small and large cells. Large cells have axons much thicker than those of small cells and that is why they send nerve impulses two times faster, i.e. at speed of approximately 4m/s, than midget cells. That property of parasol cells is of key importance for the detection of changes in the lighting of retina, which allows the observer to recognise movement. Visual movement detection of an object (as well as the movement of the observer) is tantamount to the same or similar light and shadow arrangement moving across the retina in time. The pace and direction of the movement of an image on the retina is an indicator of speed and direction of movement.
While finishing this functional characteristic of large and small neurons, it is worth noticing that, similarly to the traits of almost every visual scene, these can also be connected into two categories. Midget ganglion cells and bistratified ganglion cells are especially sensitive to color and spatial resolution of light which constitutes the basis for the perception of shapes of things in a visual scene and differentiating them from one another. It could be said that it is thanks to their activity we have a chance to separate the objects which form a visual scene from ourselves and the background. It’s the most basic function of vision and that is why the axons of midget ganglion cells and bistratified ganglion cells are so numerously represented in the optic nerve.
Parasol ganglion cells, on the other hand, thanks to high speed of signal transmission and much greater sensitivity to different shades of brightness in the visual scene than small cells, make it possible to see the movement and spatial organisation of the viewed scene, and also very effectively support the process of identifying edges of things.
Thus, the anatomical structure and physiology of the ganglion cells result in their specific functions, and the foundations of the subjective experience of viewing the image begin to emerge from them. We view the images the way we do because this is what our biological hardware is like, not due to the fact that they are like this.
From the retina to the lateral geniculate nucleus
The first structure in the brain to receive information from the retina of the eyes is the lateral geniculate nucleus (LGN) located in thalamus. Already in the 1920s, Mieczysław Minkowski, a Swiss neurologist of Polish origin, discovered that axons of small and large ganglion cells connect with LGN in a surprisingly orderly manner (Valko, Mumenthaler and Bassetti, 2006).
The structure of LGN resembles a bean grain, at the intersection of which six distinctly separated layers of neurons characterised by two different sizes are revealed (Fig. 18).
Darker layers of cells numbered 1 and 2 receive nerve impulses through the axons of parasol ganglion cells. Since the cell bodies forming these layers in the lateral geniculate nucleus [LGN] also have relatively large sizes, these layers are called the magnocellular layers, M‑type (magno) or Y‑type cells.
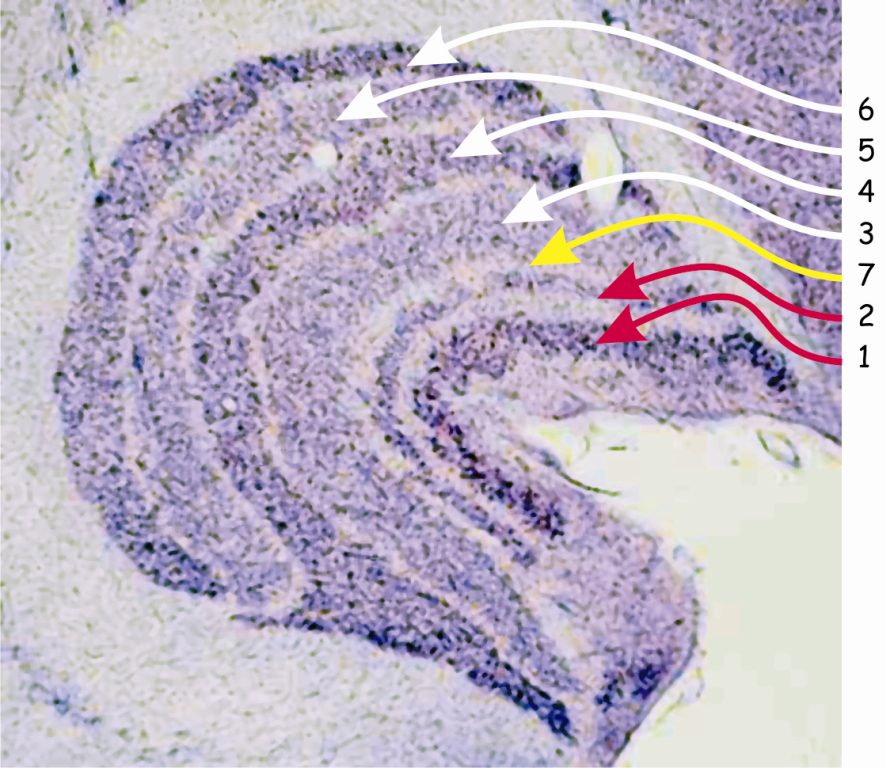
Layers marked with numbers 3–6 receive signals from axons of small ganglion cells and since they are also composed of cells with small bodies, they are called parvocellular layers, P‑type (parvo) layers or X‑type layers. The anatomy and functional traits of small and large ganglion cells located in the retina and the cells forming specific layers of the lateral geniculate nucleus are almost identical. Therefore, among researchers involved in the issue of vision, there is a consensus that umbrella ganglion cells and in two layers of LGN — M‑type cells are part of the so-called magnocellular pathway, while midget ganglion cells and in four layers of LGN — P‑type cells determine the so-called parvocellular pathway.
In Fig. 18, the seventh layer located between the magnocellular and parvocellular layers, i.e. the second and third, is also marked. In this layer there are koniocellular cells or otherwise — K cells, which receive projections from ganglionic koniocellular cells. Due to the existence of this layer in LGN, the third visual pathway, the so-called koniocellular pathway, should be added to the two previous ones. Since the cells in the koniocellular pathway constitute only about 10% of all ganglion cells and because they perform analogous functions to those performed by midget ganglion cells, the koniocellular pathway is treated as part of the pathway.
Summarising the properties of the magnocellular and parvocellular pathways of vision, it is worth to take a look at the following list.
| Characteristics | Magnocellular pathway | Parvocellular pathway |
| The size of the ganglion cell body | large | small |
| Size of the receptive field of ganglion cells | large | small |
| Speed of a nerve impulse transmission | fast | slow |
| Number of axons in optic nerve and tract | small | large |
| Color differentiation | no | yes |
| Contrast sensitivity | small | large |
| Spatial resolution | small | large |
| Time resolution and movement sensitivity | large | small |
| Sensitivity to differentiation of brightness of planes lying next to each other | large | small |
Breakdown of the layers in LGN according to the optic chiasm
LGN layers are divided not only into koniocellular, magnocellular and parvocellular, but also into right and left ones. Like most cerebral structures, LGN is an even body, i.e. it is found on both the right and left side of the brain. In primates, including humans, there is an aforementioned optic chiasm (Fig. 19) between retinas and LGN. Optic chiasm is the area where the ganglion cell axon bundles are divided into two parts. This is a very clever evolutionary invention, thanks to which the loss of one eye does not mean that any part of the brain is completely excluded from visual data processing. After the intersection of the optic nerve bundles, LGN, lying on the same side as the eye, receives data from the external (temporal) part of the retina of the eye and data from the paranasal part of the second eye retina.
As a result of the division of optic nerve axons into two parts, LGN layers marked in Fig. 18 with numbers 1, 4 and 6 receive signals from the eye on the opposite side of the head and layers 2, 3 and 5 from the eye on the same side of the head as LGN. The same rule applies to both LGN structures on the right and left side of the head.
It is worth remembering that LGN performs the function of organising sensory data related to various features of the visual scene. Having familiarised ourselves with an almost chaotic tangle of dendrites and axons of numerous cells that make up the eye retina, from this point on it is much easier to find out which cords are the source data concerning colors, edges of things, their movement and spatial organisation. Moreover, their ordering allows to predict not only from which side of the body they come, but also from which part of the eye. Seeing is a major logistical undertaking for the brain and therefore good data organisation is the basis for success, i.e. creating an accurate representation of the visual scene.
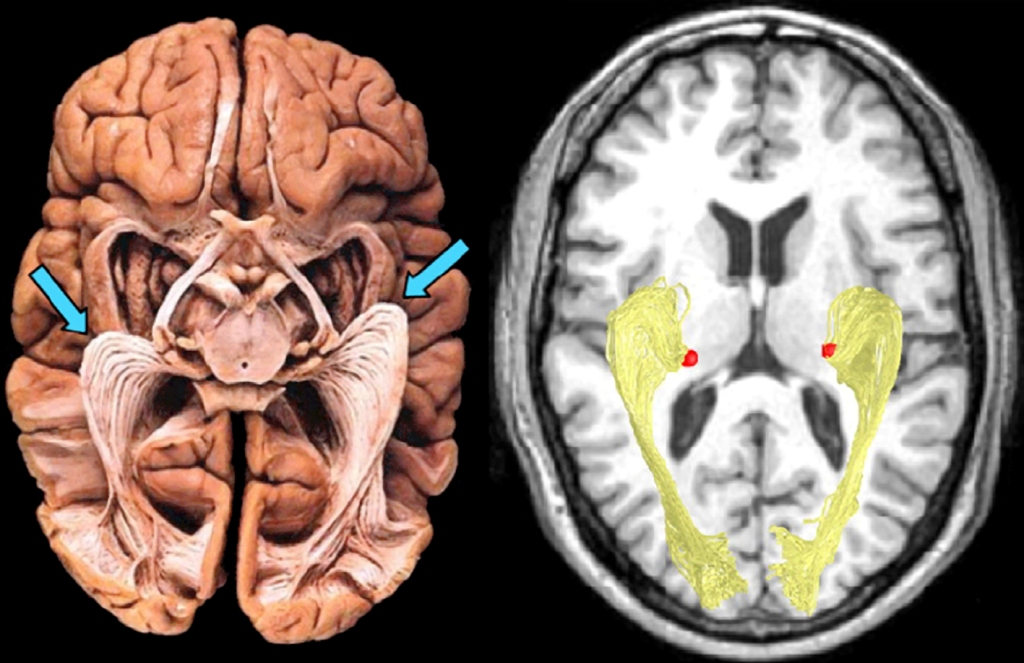
Optic radiation
The last stage of the early pathway for visual data processing ends with the so-called optic radiation. Thanks to optic radiation, data on the distribution of light in the visual scene is delivered to the visual cortex in the occipital lobe, or more precisely to the so called calcarine sulcus, located on the inner side of the lobes. Radiation, in fact, is a band of cell axons, whose bodies form individual layers in LGN. It takes its original name from a specific system of fibres, which are distributed among tightly packed structures lying underneath the cerebral cortex in a large curve (Fig. 20).
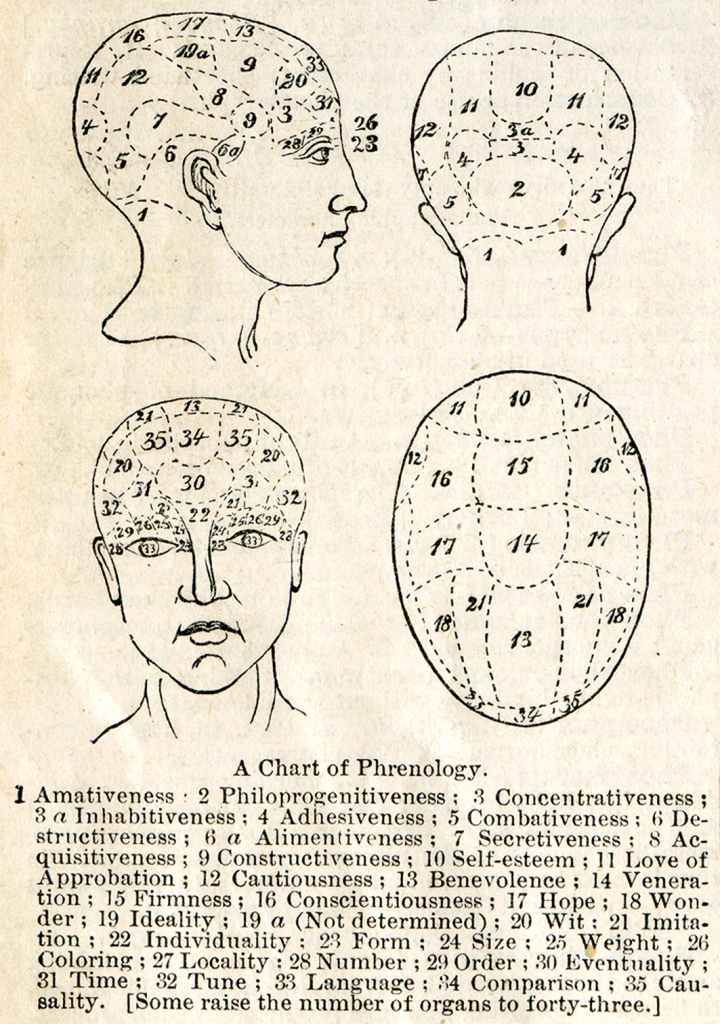
Phrenological point of view on the functions of the cerebral cortex in the process of seeing
Still at the end of the 19th century, phrenology was the dominant neuropsychological concept. In accordance with the assumptions of its creator, a German physicist Franz Josef Gall, there is a close link between the anatomical structure and the location of various structures of cerebral cortex, and the mental functions carried out by them, that is — the mind. Even though at present phrenology is regarded as pseudoscience, it was, in fact, an extraordinarily accurate intuition, which underlies the contemporary neuroscience (Fodor, 1983).
Due to the lack of appropriate diagnostic tools and methodology of neuropsychological studies, phrenologists quite freely associated psychological functions with various parts of cerebral cortex. With regard to vision, however, they had no doubts that it was conducted by the frontal, supra- and periorbital cortex. The whole part of the cortex was defined as perceptual and its different parts were assigned the functions of viewing: form (field 23), size (field 24), coloring (field 26), as well as weight (field 25). In the temporal areas of the orbital cavities they located functions related to perception of numbers (field 28) and order calculation (field 29), and in the post-periorbital cortex — language (field 33). In the frontal structures the imitation has also found its location (field 21) (Fig. 21).
Phrenologists did not even presume that seeing is a process which involves the structures of the brain furthermost from the cerebral cortex, namely the occipital love. They would rather attribute such functions as love, fertility, parental love and love for children in general (philoprogenitiveness, field 2), friendship and attachment adhesiveness, field 4), love for one’s home and homeland (inhabitativeness, field 3a) as well as ability to concentrate the attention, especially in intellectual tasks (concetrativeness, field 3).
Functions attributed by phrenologists to the temporal lobes, which — as we already know today — also play an important role in seeing. They would rather locate in them the basis for combativeness (field 5), destructiveness (field 6), and secretiveness (field 7).
The results of the studies in the field of neuroscience revealed completely different location of the structures responsible for various mental functions, particularly for vision, than in phrenology.
Visual cortex in neuroscience
Sensory data processing in the upper regions of the visual pathway is performed by approx. 4–6 billion neurons in the occipital, parietal, temporal and even frontal lobe. Overall, the data recorded by photoreceptors in the retina of the eyes involve about 20% of the total surface area of the human cerebral cortex (Wandell, Dumoulin and Brewer, 2009). Since occipital lobes play a particularly important role in the visual process, this area is also referred to as visual cortex (Fig. 22).
Due to its anatomical structure, visual cortex can be divided into two parts: striate cortex and extrastriate cortex. Striate cortex is located at the very end of the occipital lobe, in its medial part, in the area called the calcarine sulcus (Fig. 23 A). According to the classification of brain areas proposed in 1907 by the German neurologist, Korbinian Brodmann, this is area 17. Apart from the calcaline sulcus, it also involves a part of the outer occipital lobe (Fig. 23B). Area 17 is also referred to as primary visual cortex or V1 area (from the first letter of the English word vision and to emphasise that this is the first cortical stage of the visual pathway).
In both hemispheres of the brain, there are approx. 300 million neurons in the V1 area, which is 40 times more than the number of neurons in LGN (Wandell, 1995). Nerve impulses travel to V1 along the optic radiation, i.e. along the axons of the cells whose bodies are located in LGN.
The remaining parts of the visual cortex are referred to as extrastriate cortex. It basically involves Brodmann’s areas: 18 and 19, or in accordance with another notation, the areas: V2, V3, V3A, V4 and V5 (Fig. 22). Cortical structures found in all lobes of the brain are also involved in visual data analysis: in the parietal lobe, e.g. V7 or intraparietal sulcus (IPS), in the temporal lobe, e.g. inferior temporal cortex (ITC) or superior temporal sulcus (STS), and in the frontal lobe, e.g. the frontal eye field (FEF).
In order to understand what the brain does with the light stimulating photoreceptors in the retina of the eyes, it is necessary to analyse the structure and functions of all the cortical parts of the brain involved in vision.
Where do the stripes on the V1 cortical surface come from?
Striate cortex derives its name from the appearance of its surface, which resembles a bit of a zebra coloring (Fig. 24). Darker stripes visible on its surface were formed by cytochrome oxidase (COX) technique. They receive signals from the eye on the opposite side of the head than a given part of the V1 cortex area (LeVay, Hubel and Wiesel, 1975; Xinjich and Horton, 2002). As we remember, after the optic chiasm, the individual layers of cells in the right and left LGN receive signals from both the eye on the same and opposite side of the head. It is similar in the V1 cortex area. Nerve impulses from the eyes on both sides of the head travel to its both parts, i.e. from the right and left side of the brain.
In order to understand the origin of the stripes on primary cortical surface, it is necessary to look into its inside by cutting it crosswise (Fig. 25). At first glance, there are only three stripes on the cross-section of the visual cortex, two slightly lighter and one darker in between. The darker one is called the stria of Gennari, named after its discoverer, Italian medical student Francesco Gennari. No other details of the internal structure of the primary visual cortex can be seen without the microscope.
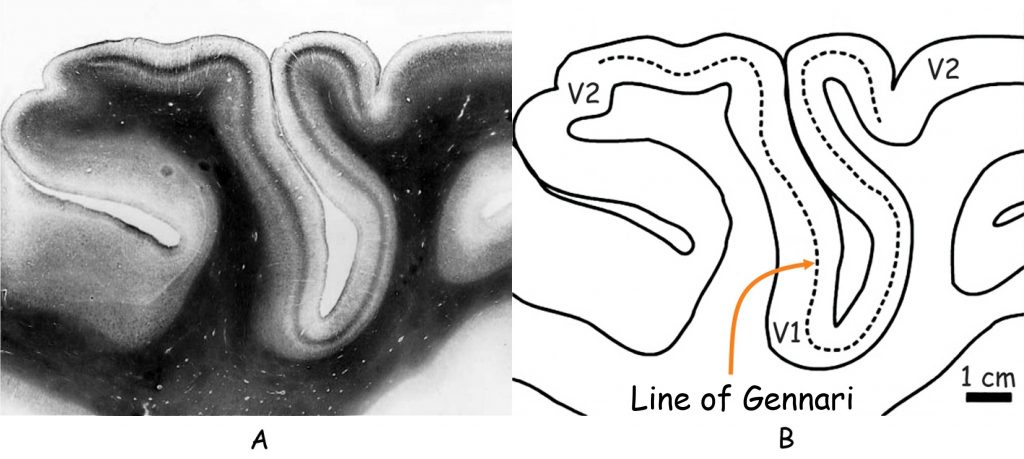
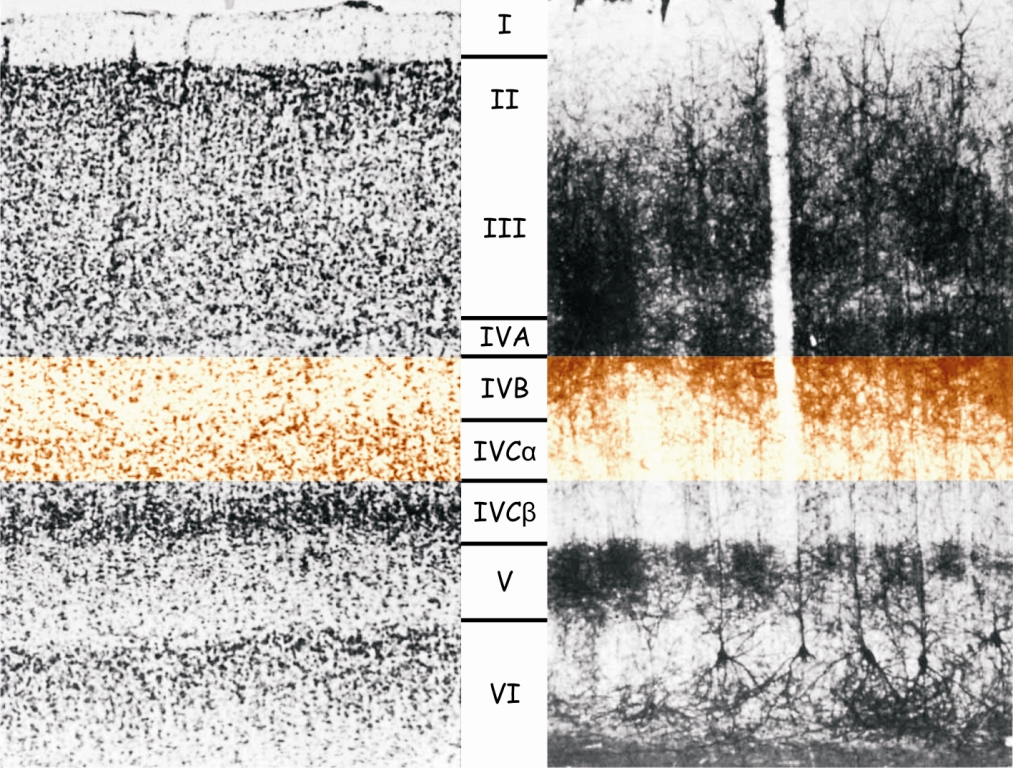
However, if we look at it under the microscope — and especially after the previous staining of the cells located there — then we will see something that resembles an orderly structure of layers in LGN. The cells in V1 cortex area are arranged in 6 horizontal layers, marked with Roman numerals, from I to VI. The widest layer is layer IV, which is divided into four thinner layers: IVA, IVB, IVCα and IVCβ (Fig. 26).
The dark stripe of Gennari, visible in Fig. 25, is a part of layer IV, or more precisely the area where the connections between layers IVB and IVCα are located. Layer IV serves as an entrance gate to the visual cortex of the brain. It is through it, and especially through the IVCα and IVCβ layers, that nerve impulses from LGN, and earlier from the retina of both eyes, reach the primary visual cortex by means of the optic radiation. Sensory data is sent to cells in other layers of the V1 cortex area only from layer IV.
Islamic architecture of V1 cortex
Another curiosity related to the structure of the primary visual cortex is that the cells that make up its individual layers are joined together to form clear columns. They are well visible in the image taken with the Golgi method in Fig. 26. Dendritic trees of the cells in layer I are like the column heads, the base of which are the cells in layer VI, and the stem — the cells in layers II to V.
Looking at the striped surface of primary cortex in Fig. 24, we can only see the heads of the individual columns. However, if the columns of cells that receive nerve impulses from only one eye are stained, then all the heads of these columns will also assume this color, and on the cortical surface we will see darker stripes (Fig. 27). They indicate where in the visual cortex there are rows of cells that receive and process signals from the right or left eye. They create some kind of colonnades, such as the ones we can admire in the Great Mosque of Cordoba. Right next to one colonnade there is another row of neuronal columns, receiving signals from the second eye, and so on.
Cell orientation
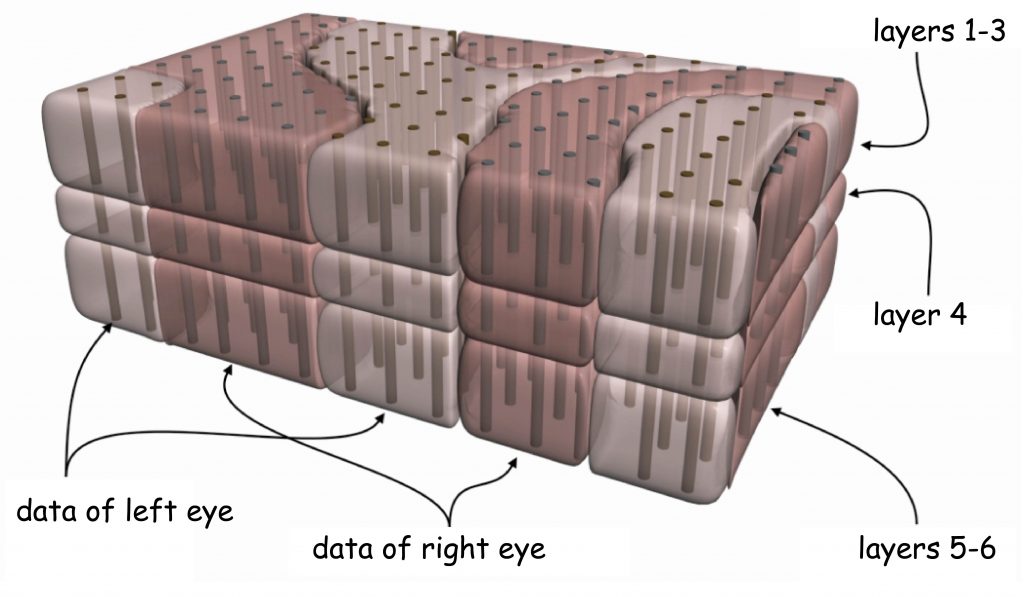
The discovery of the next property of the primary visual cortex ended with the award of the Nobel Prize in 1981 to two neurophysiologists David Hubel and Torsten Wiesel. While experimenting with feline visual cortex they found that columns of cells, which react to the data incoming from one eye, standing beside one another, are specialised in terms of spatial orientation of the fragments of objects’ edges recorded by the eye. It means that within cortex V1, cell columns are ordered in two planes.
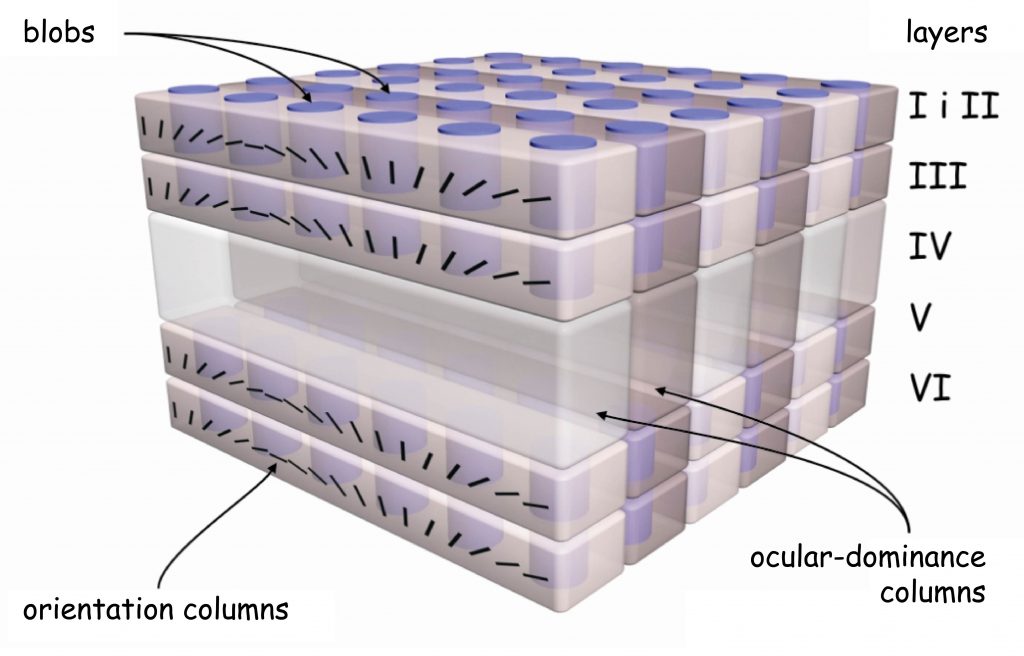
One plane is defined by the cells reacting independently from one another to data incoming from the right and left eye. In turn, the other plane is located across the first one and comprises cells which react to various angles, at which the edge fragment of a given object is seen, regardless of which eye recorded it. Describing this astonishing structure of the primary visual cortex, Hubel and Wiesel (1972) proposed a functional model of cell column arrangement in V1, known as the ice-cube model (Fig. 28).
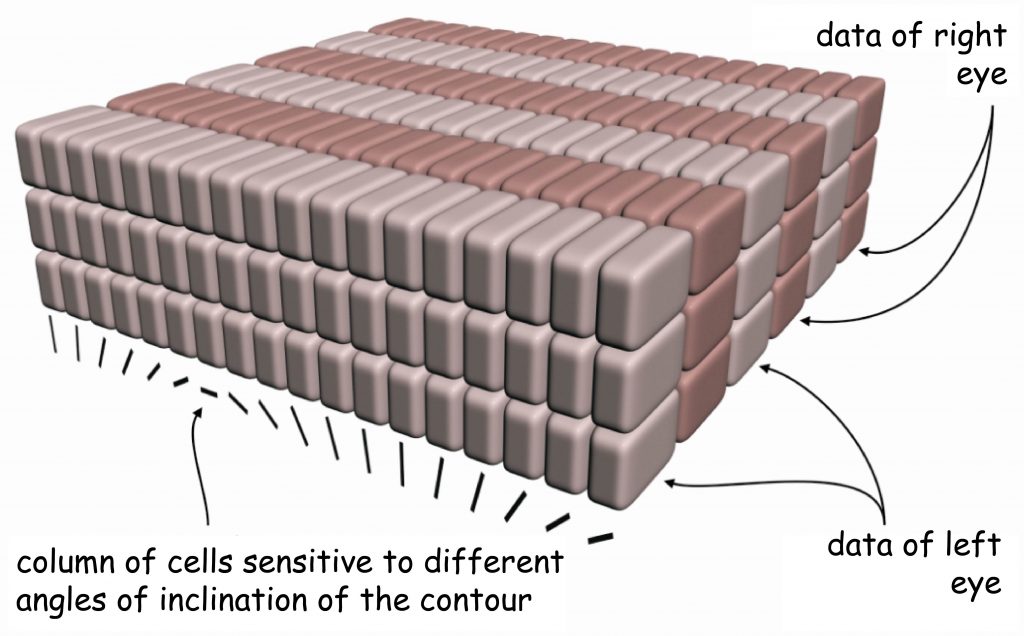
Of course, this model should not be treated literally, if only because — as we saw when looking at the V1 cortical surface — rows of neuron columns reacting to signals coming from one or the second eye are not arranged in straight lines. Nevertheless, this model illustrates perfectly the general principle of functional ordering of the internal structure of the primary visual cortex.
It seems that already at the initial stage of the visual pathway, the image projected onto the retina of the eye is spatially divided into thousands of small pieces. Each of these pieces contains information about its location on the retina and about the orientation of the edges of the adjacent surfaces differing in light intensity. In the primary visual cortex, the content of all these pieces is analysed and, depending on the retina site and the orientation of the registered edges, a specific group of cell columns is activated. This is probably how the information on shapes of things is being encoded. In the further stages of the visual pathway it is used to reconstruct the objects forming the entire visual scene.
At first glance it may seem completely irrational that, when a complete image of a visual scene is obtained on the retina, the visual system first decomposes, and then reassembles it. On closer examination, however, we must conclude that it would be difficult to invent a more economic system for visual data processing. What needs to be done is to consider the unimaginable amount of data provided to the brain by stimulated cones and rods every second when our eyes are open. In other words, the complexity and variability of visual scenes over time require from the visual system a system approach based on a number of clear principles. They come down to the analysis of visual data due to the most important properties of both the visual scene and the device that registers them, i.e. the retina.
If countless shapes of all things seen can be determined by means of the differences in the brightness of two-dimensional planes on which the edge of the shape is outlined, it is incomparably easier to encode these shapes using a relatively small number of cells sensitive to edge orientation within the range from 0 to 180°, than by means of an impossible to estimate number of cells and their connections, which would remember each shape with all its appearances. Although this option is “seriously considered” by the brain, also for economic reasons.
It transpires that even single cells can encode shapes of complex things, but only those that are very well known and strongly fixed in brain structures. Obviously, not in cortex V1, only at further stages of the cortical pathway of vision. They are the so-called grandmother cells, which react selectively to particular objects or people (Gross, 2002; Kreiman, Koch and Fried, 2000; Quiroga, Kraskov, Koch and Fried (2009); Quiroga, Mukamel, Isham, Malach et al. (2008). At this point, it is worth reminding that the possibility of encoding complex shapes by single cells was discovered and described already in the 60s by an eminent Polish neurophysiologist, Jerzy Konorski (1967). He called these cells gnostic neurons. In accordance with his concept, they constituted the highest level of processing the data on the shapes of the seen objects, recorded by the gnostic fields, composed of many cells at the earlier stages of the visual pathway.
Returning to the equally grand discoveries of Hubel and Wiesel it is worth adding that they identified not one, but two types of column-forming cells in cortex V1. Apart from columns of cells sensitive to the angle of inclination of edges, the so-called simple cells, they also found presence of cells, which react to the direction of movement. They are the so-called complex cells. The movement of objects in the visual scene will not be analysed within this monograph, therefore I will not focus on this thread here.
Retinotopic map in the striate cortex
The description of the extraordinary properties of the primary visual cortex presented in the previous chapter is far from complete. Knowing already the internal structure of the V1 cortex, let us return again to its surface. And here is where the next surprise is awaiting us.
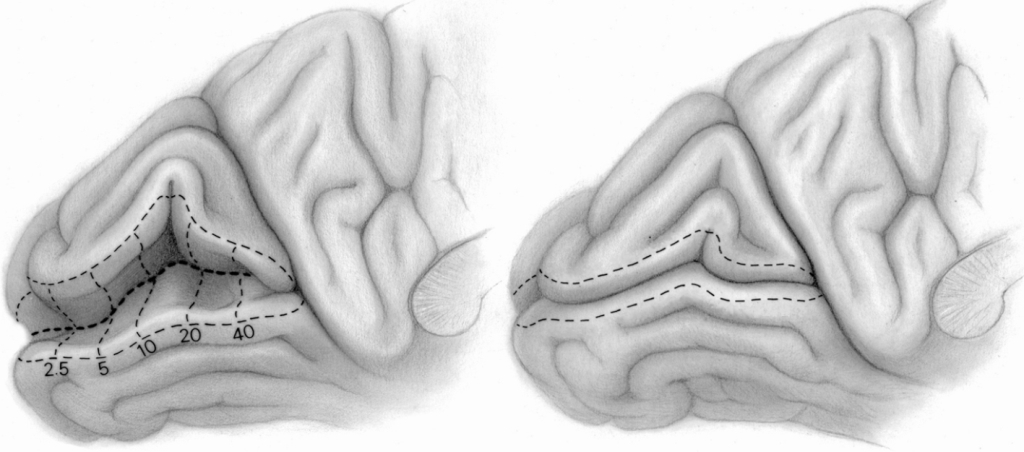
The rows of cell columns that receive signals from the retina of the right and left eye reflect the order of the photoreceptors within them. This is not a 1:1 representation, but an algorithm is known to predict which neuron columns in the primary visual cortex will respond to a specific part of the retina in response to stimulation. The complex logarithm transformation was developed by Eric L. Schwartz (1980) on the basis of the anatomical location of connections between ganglion cells that collect information from different parts of the retina and different parts of the V1 cortex in the right and left occipital lobe (Fig. 29).
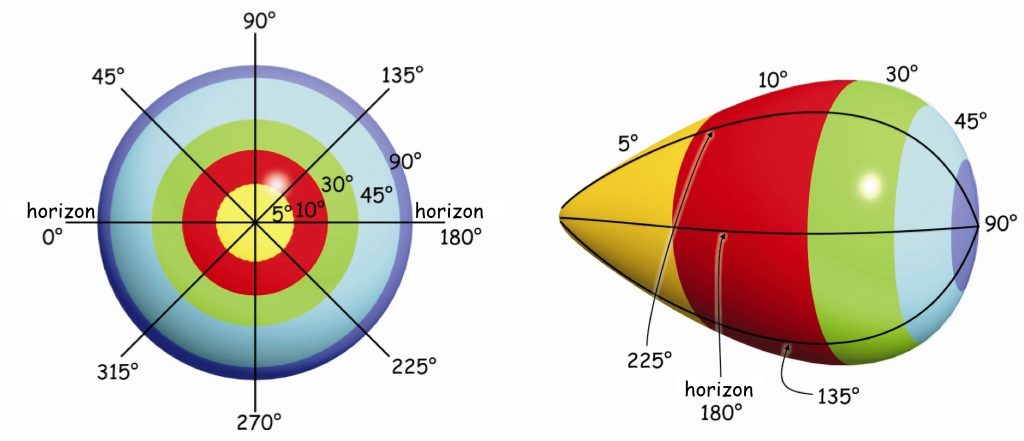
Figure 29 shows that approximately 30% of neuronal columns in the primary visual cortex receive data from the macula area, which covers a field of vision of up to 5° (yellow color). The next, third part of the neuronal columns in V1 is responsible for the area of the retina between 5° and 20° of the field of vision (red color) and, finally, the rest of the cortical neurons in the area 17 (green, light and dark blue colors) covers the remaining area of the retina, i.e. between 20° and 90° of the field of vision.
Since, as we remember, most of the data travels along the axons of the midget ganglion cells and bistratified ganglion cells, so the so-called parvocellular pathway, the most columns of cells receive these data in the V1 cortex . If we remember that tiny ganglion cells support mainly the areas of the retina that are located in the fovea, then it will be easy to understand that the number of columns of cells involved in this type of data is disproportionately higher than the number of columns receiving data from other parts of the retina.
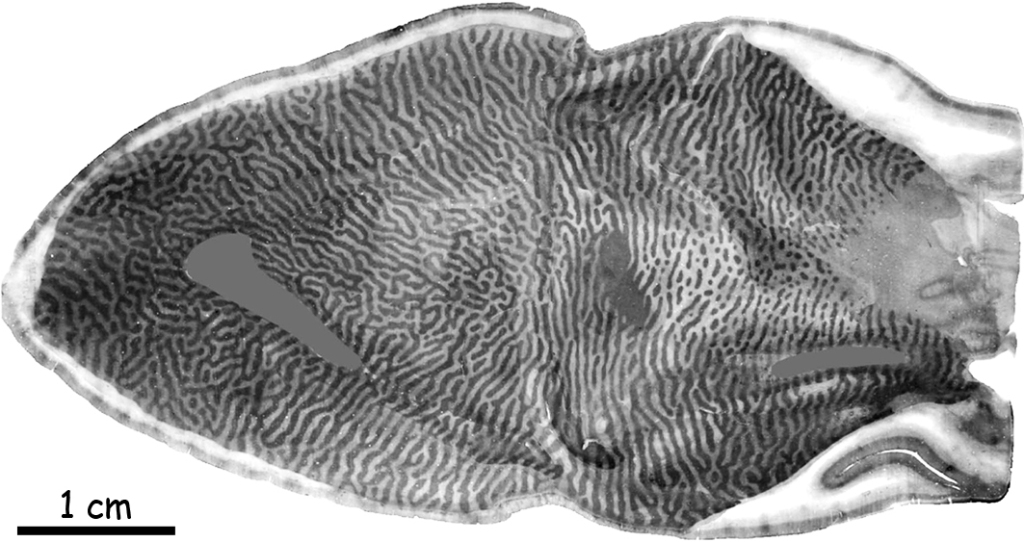
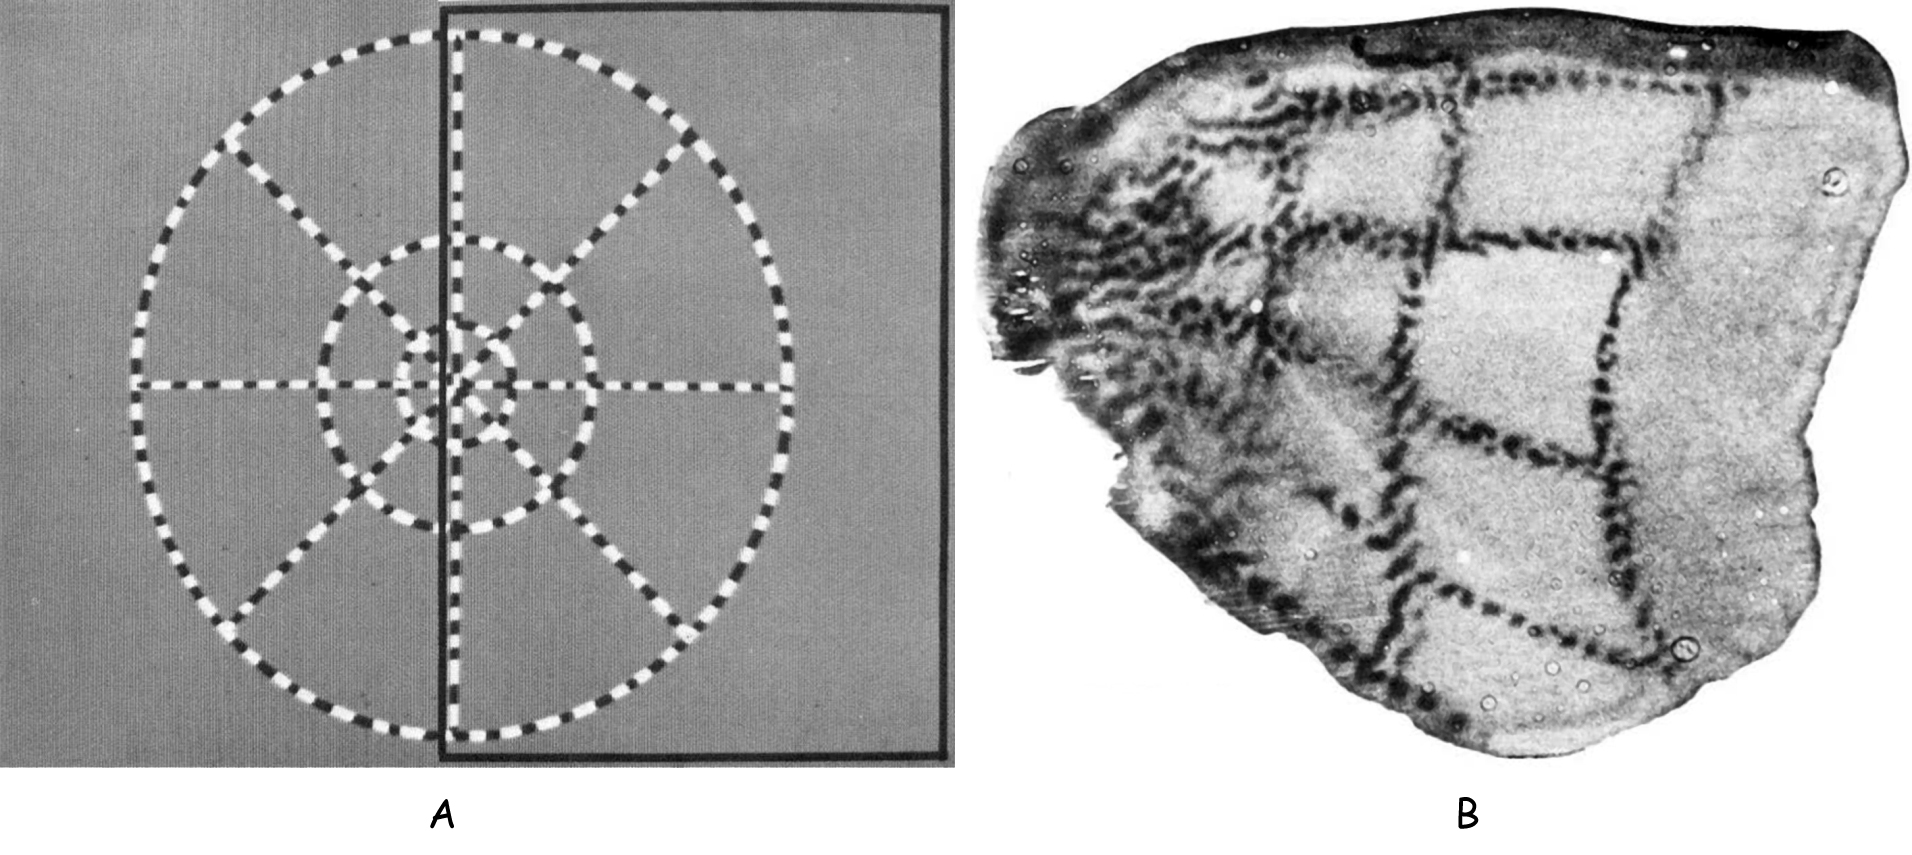
One of the first studies to record the visual stimulus reactions of cells in the V1 cortex area was conducted by Roger Tootell and his associates on macaques (Tootell, Silverman, Switkes and de Valois, 1982). They demonstrated the effect of reflecting a pattern of a figure seen by a monkey in the V1 cortex area (Fig. 30). It is worth noting that the clearest representation was obtained in the IVC layer. This is understandable as it is at this level that signals from LGN reach V1.
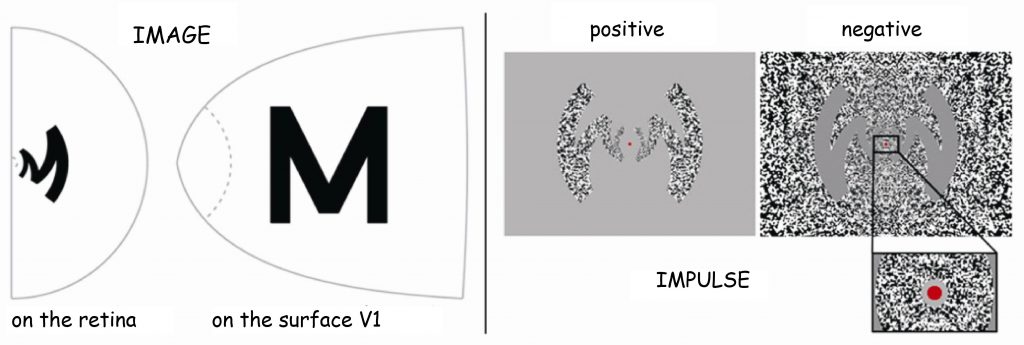
The second example illustrates even more clearly how much we already now about the retinotopic organisation of cortex V1 — not only in macaques, but also in humans — and its activity during seeing. In the studies, to which I would like to draw attention to — the reaction of human visual cortex was recorded using the fMRI 7T scanner (Polimeni, Fischl, Greve and Wald, 2010). This time, the studied person viewed two versions of the letter “M”, positive and negative, on a computer screen (Fig. 31B). Its form was adequately processed using the above-mentioned Schwartz algorithm, which determines the spatial relationships between the image projected onto visual hemifield and its reflection on the surface of the cortical surface (Fig. 31 A).
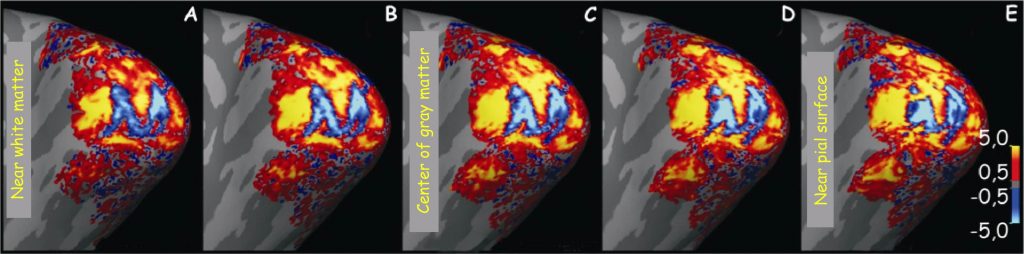
By exposing the distorted visual stimulus, it was intended to check to what extent neuronal columns, which are sensitive to different angles of edges formed at the contact point of contrasting surfaces, would accurately reflect the form of the letter “M”. The activity of neurons in the V1 cortex area was measured during the visual fixation by the respondents on the middle red spot and it was found that at the IVC layer level the image of the letter “M” was fairly well reflected (Fig. 32 C; blue shape).
I believe we do not have to convince anyone what huge opportunities arise from these discoveries in terms of restoring vision in people who lost it as a result of an illness or a mechanical damage to the eye retinas. Instead of the data sent by the photoreceptors located in the retinas of the eye to V1 cortex, signal can be sent to them directly from the video camera. After processing it using the Schwartz algorithm and stimulating cells in the primary visual cortex with electrodes, a visual experience can be created. There is a lot of evidence indicating that it soon will be possible.
Some more information about blobs and colors
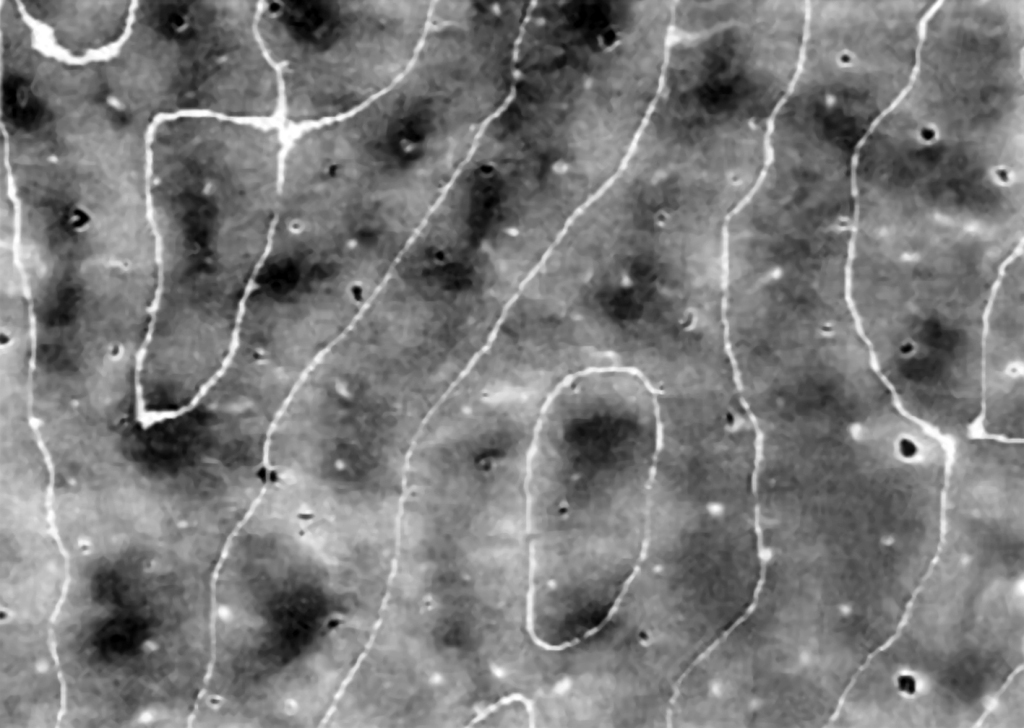
While discussing the structure and the functions of the primary visual cortex, we cannot omit one other element. Between cell columns, which separately receive information on the spatial orientation of edge fragments from both eyes, there are small cylindrical clusters of neurons playing an important role: among other things, in color perception (Livingstone and Hubel, 1984). They can be found in basically all layers of the visual cortex, except for layer IV (Fig. 33).
In the Polish translation of the English name “blobs”, they are referred to as “kropelki” [“droplets”], “plamki” [“spots”], and even “kleksy” [“blotches”] (Matthews, 2000), while the original name of this structure, discovered by Jonathan C. Horton and David Hubel (1981) i.e. “łaty” [“patches”] is used less frequently. These names derive from the fact that after dissecting V1 cortex longitudinally and staining it using the cytochrome oxidase method slightly irregularly distributed blobs between the cell columns, reacting to the orientation of the edges of the seen objects, can be observed on its surface. 34).
Inputs and outputs of V1 cortex
Wrapping up the journey into the primary visual cortex, it is worth ordering the knowledge regarding its connections with other structures of the brain. It is, first and foremost known, that most data from the LGN reach V1 cortex via a wide tract, also known as optic radiation. The axons of cells forming optic radiation are connected with the cells of V1 cortex at the level of layer VI. These axons form three visual pathways: magnocellular, parvocellular and koniocellular.
The magnocellular pathway is connected with V1 cortex at the level of IVCα layer, and it conveys the data concerning brightness of visual scene fragments. They are not encoded with resolution as high as in the case of the data flowing through the parvocellular pathway, but they encompass much larger areas of the watched scene. These data constitute a basis for global, spatial organisation of objects located in a framed scene. Moreover, the magnocellular pathway conveys signals which constitute a basis of seeing movement. Both the perception of global spatial organisation within a visual scene and the perception of its variability are essential for out orientation in space. The data coming from the IVCα layer through the magnocellular pathway reach layer IVB, neighbouring it. From that area, they will be sent in two directions: to V2 cortex and V5 cortex, also known as the medial temporal area (MT), which specialises in processing data concerning movement in a visual scene (Fig. 35).
The axon-rich parvocellular pathway connects with V1 at the level of layer IVCβ. It conveys two types of information: on the length and intensity of the light wave stimulating various groups of cones in the retina, namely on the color and luminance. These data are on the one hand characterised by high spatial resolution, and on the other they are limited to a relatively small portion of the field of vision. The information on the length of the light wave, particularly in terms of the opposition of the red and green color, is sent from layer IVCβ to clusters of neurons forming blobs, and from there — to V2 cortex. On the other hand, the information on the intensity of the lighting, which constitutes an important basis for seeing edges, flows from layer IVCβ, along the columns sensitive to specific angles of edge fragments (especially in layers II and III) and is sent to V2 cortex from this place as well.
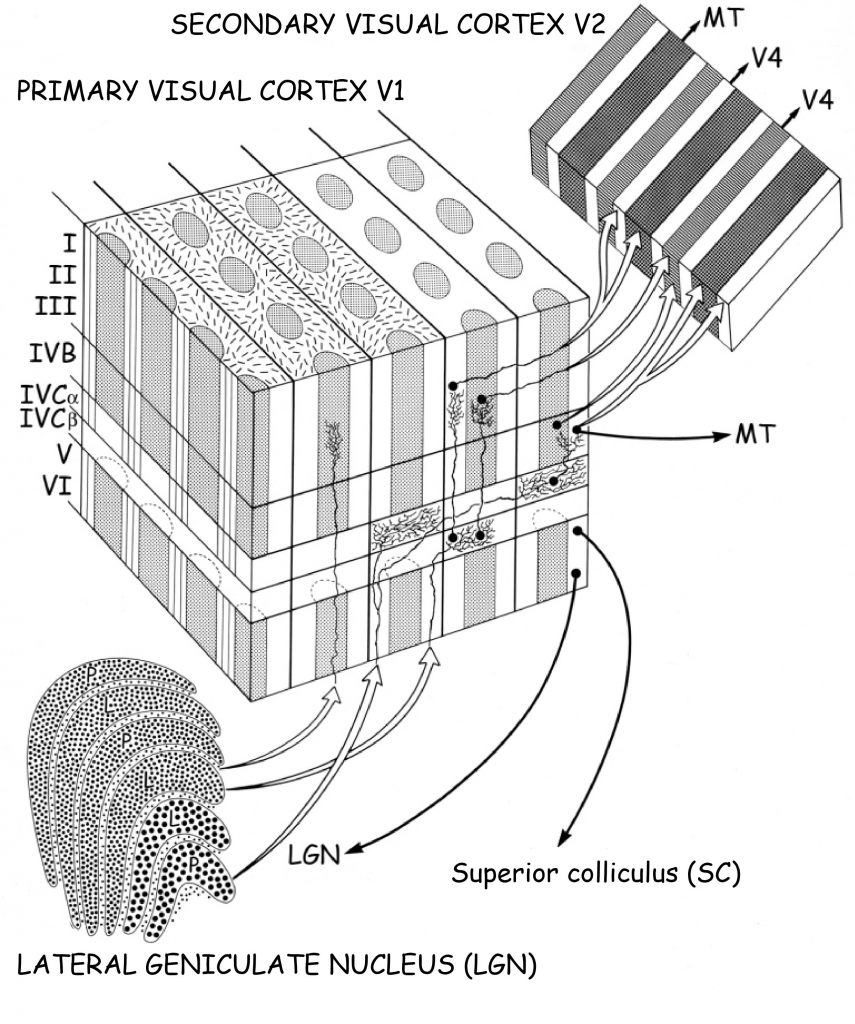
It is somewhat different in the case of the koniocellular pathway, which connects directly with clusters of neurons forming cylindrical blobs in V1 cortex, without the intermediation of columns in layer IV. Data concerning the color blue and yellow are transmitted through the koniocellular pathway. From the blobs, they flow further towards V2 cortex.
V2 cortex
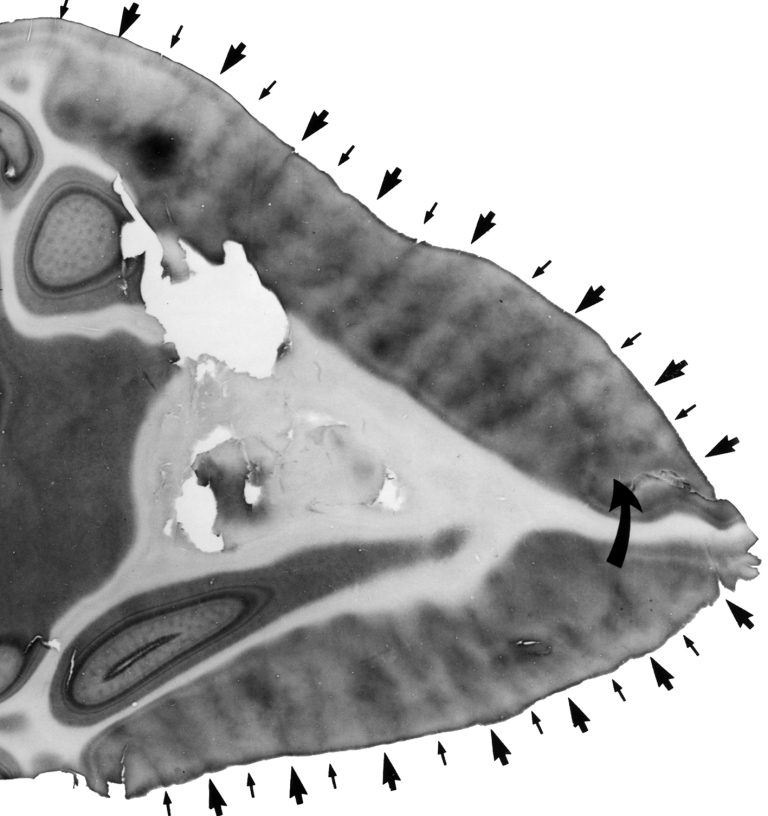
A vast majority of the data reaching V1 cortex from the retina through the LGN is forwarded to V2 cortex or, according to Brodmann classification — field 18. Just like V1, it consists of neighbouring cellular structures of various anatomical structures. After being stained they can be easily told apart as they form characteristic stripes (Fig. 36). We can basically distinguish three types of stripes in V2 cortex: thin stripes, thick stripes, which are stained dark, and the so-called pale stripes, which remain bright during staining (Matthews, 2000) The stripes lay in the same pattern along the entire V2 cortex, that is: thin stripes — pale stripes — thick stripes — pale stripes — thin stripes — pale stripes and so on.
Moreover, a half of the cells in V2 cortex reacts almost identically to the cells in V1 (Willmore, Prenger and Gallant, 2010). It most probably means that they process data concerning simple features of a visual scene, such as parts of edges, their orientation, the direction of movement and colors (Sit and Miikkulainen, 2009). These cells, however, are not as well organised in terms of topography as those in V1 cortex. The other half of V2 cells is responsible for more complex features of visual scenes. They are, among other things, active in response to illusory contours or contours defined by the texture of the surface (von der Heydt, Peterhans and Baumgartner, 1984; von der Heydt and Peterhans, 1989) as well as complicated shapes and their orientation (Hegdé and van Essen, 2000; Ito and Komatsu, 2004; Anzai, Peng and van Essen, 2007).
Each type of stripes receives different data from V1, in accordance with the breakdown of the visual pathways into three categories on the basis of their functions, which has been already mentioned several times. Thus, data from the blob areas in V1 are forwarded to the cells forming thin stripes in V2. In these stripes, the anatomical differences between the cells forming koniocellular and parvocellular pathways are fading out, and integration of all data which constitute the basis for seeing colors occurs. In other words, neurons forming the thin stripe in V2 cortex are specialised organising data with various lengths of the electromagnetic wave, which creates the entire spectrum of the seen world. These data are then forwarded both directly and via V3 cortex to V4 cortex, also known as the cortical color centre (DeYoe and van Essen, 1985; Shipp and Zeki, 1985; van Essen, 2004). On the basis of fMRI examination results Derrik E. Asher and Alyssa A. Brewer (2009) suggest that in terms of color processing in V4 field, there are significant differences between the hemispheres. It turns out that in the cortical color centre on the right, the neurons are much more sensitive to chromatic stimuli than to achromatic stimuli, and in the V4 field, located on the left side, no differences in the response of the neurons to chromatic and achromatic stimuli was found.
As we remember, high-resolution vision of shapes based on contrasts in the luminance range has its source in the data transmitted via the parvocellular pathway, which, from the colonnades in V1, reach the pale stripes in V2. It is one of the most important structures in the visual cortex, the activity of which constitutes the basis for organisation of data enabling recognition of object shapes in visual scenes. Data from pale stripes in V2 are also sent to V4.
Brain structures which receive projections from V4, namely the inferior temporal gyrus (IT) and the fusiform gyrus with a particular area known as the area of face recognition fusiform face area (FFA) are responsible for integrating the data concerning shapes of the objects seen (Fig. 37).
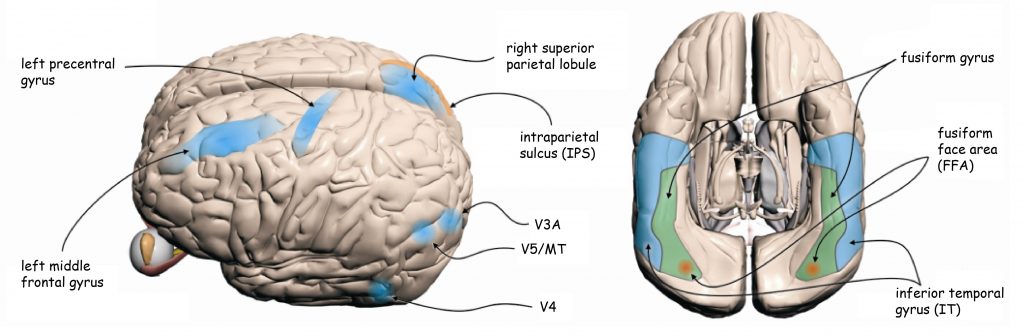
The third type of stripes in V2 cortex are dark and thick stripes. Two categories of data from V1 reach this area: data on the spatial organisation of a visual scene and movement. Data on global spatial organisation enable both verification of the presence of certain objects in visual scenes (thus, they also constitute the basis for seeing their shapes) as well as their distribution in relation to each other. Due to relatively low resolution, these date perform the function of general orientation in space and — depending on the situation — they constitute an impulse to focus attention and perform more detailed analysis of selected parts of a given scene by systems responsible for high-resolution seeing. Signals coding information concerning the global spatial orientation are forwarded to V3 cortex.
On the other hand, the second category of data flowing from V1 to the thick, dark stripes in V2 constitutes the basis for seeing movement. From there they are led to the aforementioned MT area, namely V5 cortex and further V3A, which constitute the cortex centre of movement perception (Roe and Ts’o, 1995; Shipp and Zeki, 1989) (Fig. 37).
Ventral and dorsal paths
Apart from integrating the data incoming from V1, V2 cortex also constitutes an extremely important node in the visual pathway, in which two new, partially independent of one another, visual pathways begin: the ventral path and the dorsal path (Milner and Goodale, 2008). Their names also derive from their location in the cerebral cortex. If we imagine the brain as an animal, for example a fish, then the structures located at its top surface, namely the parietal lobes, would resemble the dorsum, whereas the structures located at the bottom (for example the temporal lobes) — with the abdomen (Fig. 38). Hence the names of the paths. Just like the subcortical koniocellular, parvocellular and magnocellular pathways, located at the earlier stages of the visual pathway, also both cortical paths differ from one another in terms of their anatomy and function.
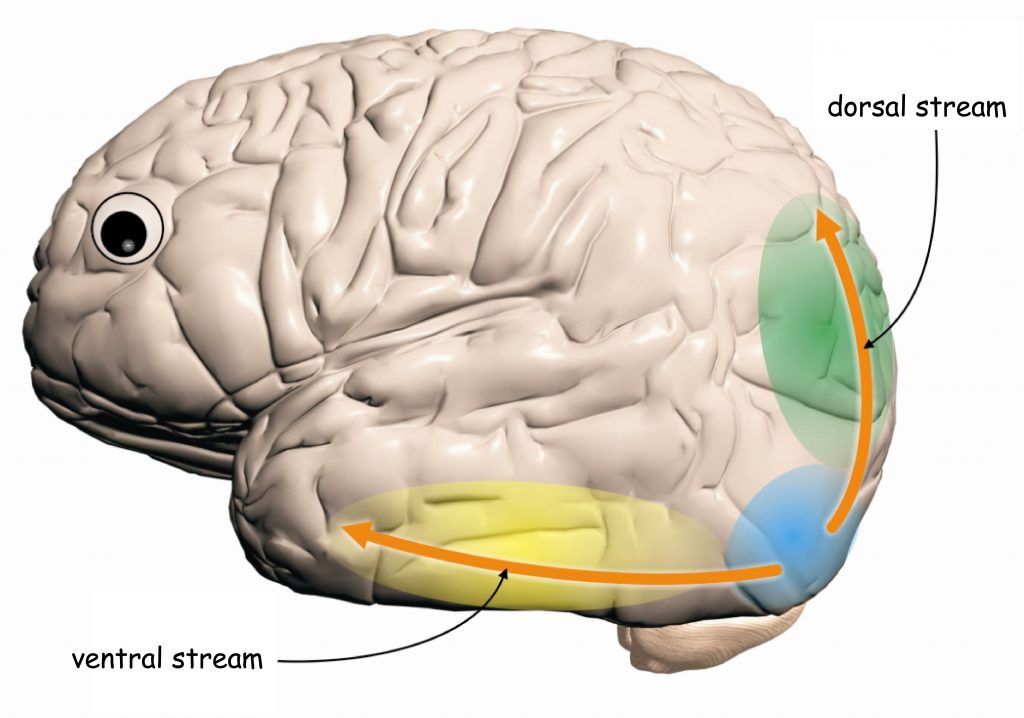
The history of discovering these two pathways dates back to the 80s of the previous century. In 1982, Leslie G. Ungerleider and Mortimer Mishkin published the results of the studies on the activity of cerebral cortex in rhesus macaques, during performance of tasks which required either differentiating between objects or locating the objects using vision. Of course, at the time, no magnetic scanners were used for the purposes of locating the activity of various parts of the brain during task performance. Hypotheses regarding the function of certain brain parts were tested by surgical removal of the part of the monkey’s brain, which was thought to be of any significance for proper performance of a given task and then — obviously after recovering — the monkey would perform the task. If it performed it worse or did not perform it at all in comparison to those monkeys whose brain remained undamaged, it was concluded that the removed part was responsible for proper performance of the task. This way, Ungerleider and Mishkin established that if the temporal part of the brain, encompassing the surroundings of V4 and IT, was damaged, then the monkeys had serious problems with properly recognising the objects known to them, yet they performed tasks which required them to locate objects in space quite well. On the other hand, the monkeys with damaged parietal lobes, especially in the area of V5/MT cortex, were not able to use spatial guidelines, but recognised objects known to them easily (Mishkin, Ungerleider and Macko, 1983; Ungerleider, 1985).
The results of the research conducted by Ungerleider and Mishkin (1982) were included in the concept according to which data reaching V2 cortex from the central parts of the retinas through the parvocellular and koniocellular pathways are transmitted towards the temporal lobe and form the basis for identification and recognition of objects in the visual scene. On the other hand, the data flowing through the magnocellular path (that is, from the peripheral parts of the retinas) are sent towards the parietal lobe and constitute the basis for locating objects in the scene.
The first path was conventionally named the “what”-type path, on account of the fact that activation of brain structures located along this path makes it possible to recognise objects, in particular their shapes and colors, which provides an answer to the question: “what is it?”. On the other hand, the second path was named the “where”-type path because the brain structures that form it are active when the cognitive task requires spatial orientation in relation to objects present in a visual scene, which leads to answering the question: “where is it located”?
Ten years later, Melvyn A. Goodale and A. David Milner (1992) proposed an alternative concept of the function of both visual pathways. They basically did not question the view, according to which the ventral path “deals” with such properties of visual scenes as the shape and color of objects located in it. According to them, the brain structures which are active in the ventral path actually constitute the basis for recognising objects noticed in visual scenes on the basis of the recorded sensory data concerning the distribution of brightness and colors as well as such complex objects as, for example, the human face.
The most important modification of the Ungerleider and Mishkina concept concerned the function of the dorsal path. According to Goodale and Milner, activation of the brain structures which form this pathway enables the observer to not only orient themselves in space and the distribution of the seen objects in a scene, but also to control their own behaviours in the space.
They reached such conclusion while observing the behaviour of a patient, known by the initials D.F., who suffered from the so-called visual agnosia, i.e. inability to recognise seen objects. Her problems resulted from extensive damage of the brain structures in the area of the ventral path. The most amazing fact was that even though D.F. experienced significant difficulties in recognising objects, she could use them quite well, performing accurate motor and movement tasks. It was caused by the fact that the dorsal path, responsible for carrying out these tasks, was damaged in this patient. The detailed description of the D.F. case and the presentation of their concept of visual pathways, was presented by Milner and Goodale in the book published in 1995 (the Polish translation was published in 2008 on the basis of the 2nd English issue from 2006).
To summarise, from Ungerleider and Mishkina’s perspective, the dorsal path allows the observer to cognitively grasp the location and the spatial relations between objects in a visual scene. The observer resembles a viewer watching a 3D movie in a cinema, in which space is presented to them in all its complexity, and they systematically maintain the relations between the objects seen. On the other hand, in accordance with the suggestion of Goodale and Milner, visual orientation in space, possible thanks to the activity of the brain structures located in the dorsal path, is only the starting point in terms of controlling one’s own behaviour in this space. The function of the dorsal path, understood in such way, turns a passive observer of a visual scene, in relation to which they are in an external position (of a, for example, cinema lover), into an actor, within the watched scene (i.e. a mountaineer). What is more, in the watched space, the actor assumes the central (egocentric) position, and all relations between the observed objects are relativized to the place they occupy in this space as well as to the motor tasks, which are to be performed by the observer.
Data integration from both visual pathways
It would be odd, if both discussed visual pathways operated in complete isolation from one another. The case of D.F. showed that damages to the ventral path, resulting in the inability to recognise objects using vision, do not distort the ability to manipulate the objects. Nonetheless, an increasing number of data also indicate the fact that both pathways communicate, and the results of their activity are integrated, creating a subjective experience of multifaceted contact with the object.
Mark R. Pennick and Rajesh K. Kana (2011) asked the studied persons to perform to types of tasks. One of the tasks consisted in identifying and naming the presented objects, and the other — on determining their position in space. During the performance of theses tasks, brain activity of the participants was recorded using functional magnetic resonance imaging (fMRI). In line with the expectations it turned out that while performing the identification task the structures located along the ventral path were particularly active, whereas during the location task — along the dorsal path. The researchers, however, were interested in whether there are structures which are active regardless of the type of task performed. It turned out that that there are several structures of the kind, which most probably integrate the data from both visual pathways. They are located particularly in the frontal lobe, such as the left middle frontal gyrus (LMFG) and the left precentral gyrus (LPRCN) as well as in the parietal lobe: the right superior parietal lobule (RSPL) and the intraparietal sulcus (IPS) (Fig. 37), located directly beneath it.
All these structures form a type of an association network collecting data from various sources, and then compiling them into a form, which can be sensed by us, not only as an experience of seeing, but also as an experience of object existence in the world we live in. The results of the studies conducted by Pennick and Kan confirm the earlier reports regarding the functions of the above-listed brain structures (Buchel, Coull and Friston, 1999; Clayes, Dupont, Cornette, Sunaert et al., 2004; Jung and Haier, 2007; Schenk and Milner, 2006).
VISUAL SCENE FRAMING SYSTEM
Frame, or the range of vision
We more or less know how the retina screen on which the light getting into the eye reflects visual scenes is built. We also know something on the optical system of the eye. It is, therefore, good to realize what shape and size of the field of vision is, namely — again referring to the metaphor of the camera — what is the size of a single frame, limited by the frames of the exposed field.
The topic of the field of view (FOV) is discussed in photography a lot; it refers to the angle between the most distant light points in a horizontal or vertical plane on the image sensor, which were recorded using a lens with a determined focal length. For example, the field of view for the focal length of 50 mm records an image on a matrix or frame with dimensions 24 × 36 mm within range of 40° in the horizontal plane and 27° in the vertical plane.
The concept of the field of vision is analogous to the concept of the field of view. The field of vision means the area recorded by a still eye in an immobilised head. In the horizontal plane it is equal to 150–160° (60–70°) in the paranasal area and approx. 90° in the temporal area), and in the vertical plane approx. 130° (50–60° above the visual axis and 70–80° below the visual axis) (Fig. 39).
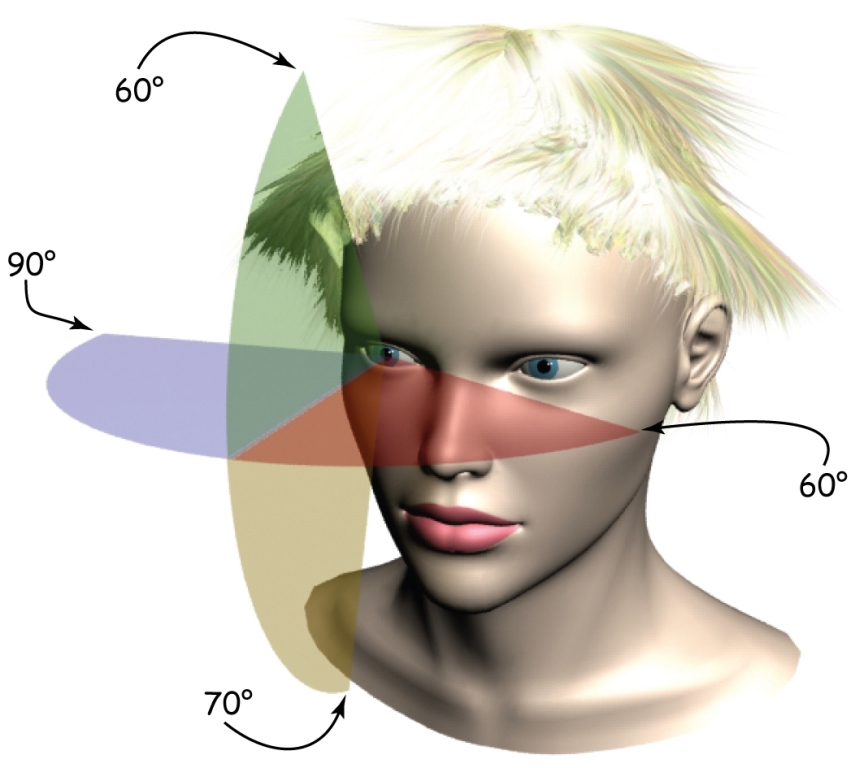
The scope of the field of vision is significantly less regular than the rectangular shape of the photographic matrix. The difference in terms of shape and size of both fields of vision (the eye and the camera) is illustrated in Fig. 40. It schematically presents the shape of the retina of the right eye, which is projected on the surface of a sphere, with marked field of vision of a person subjected to the perimetric examination. The aim of such examination is to mark the outline of the field of vision of a still eye in all possible directions.
I applied an outline of a small-image frame of 24 mm x 36 mm onto the central part of the eye’s retina, exposed in a camera with focal length of 50 mm (marked in orange). It covers a small part of the entire field of vision. As we remember, in the distance of approx. 20° of the field of vision from the fovea in each direction the number of cones on the retina radically decreases. It means that a 50-millimetre lens perfectly covers the part of the field of vision which is characterised by the highest resolution and sensitivity to the differentiation of the electromagnetic wave length in terms of visible light. For this reason, a lens of such focal is known as the standard lens.
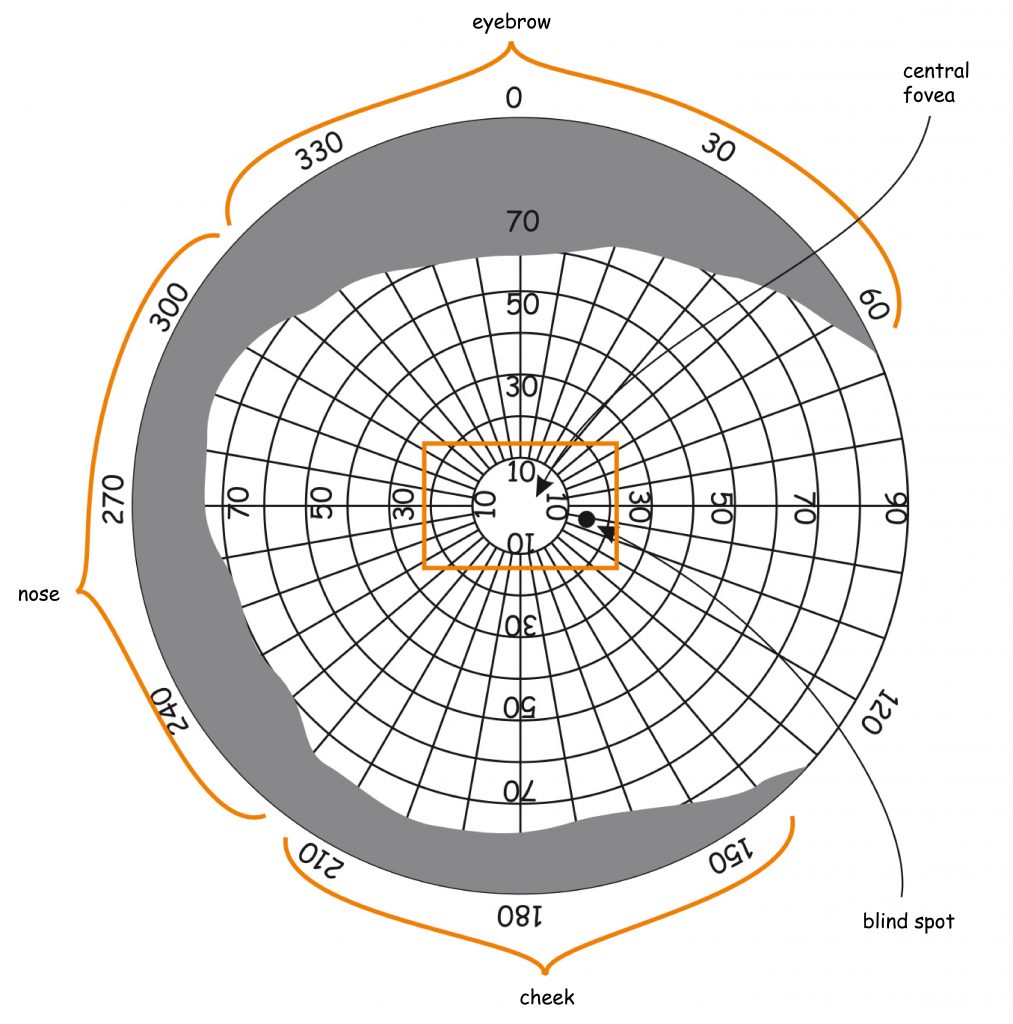
Due to the fact that we generally view things using both our eyes (stereoscopically), it would be right to attach an illustration of the scope of the binocular field of vision (Fig. 41). Changes are not significant in the vertical plane, but in the horizontal plane the field of vision is considerably widened, at least to 180°. The chart also includes a small image frame corresponding to the range of vision of a 50mm lens (marked red), as well as a wide-angle lens with a focal length of 13mm, which enables large objects to be photographed from a short distance (marked green). Only a wide-angle lens with such small focal length covers most of the field of vision of a human watching a scene with both eyes.
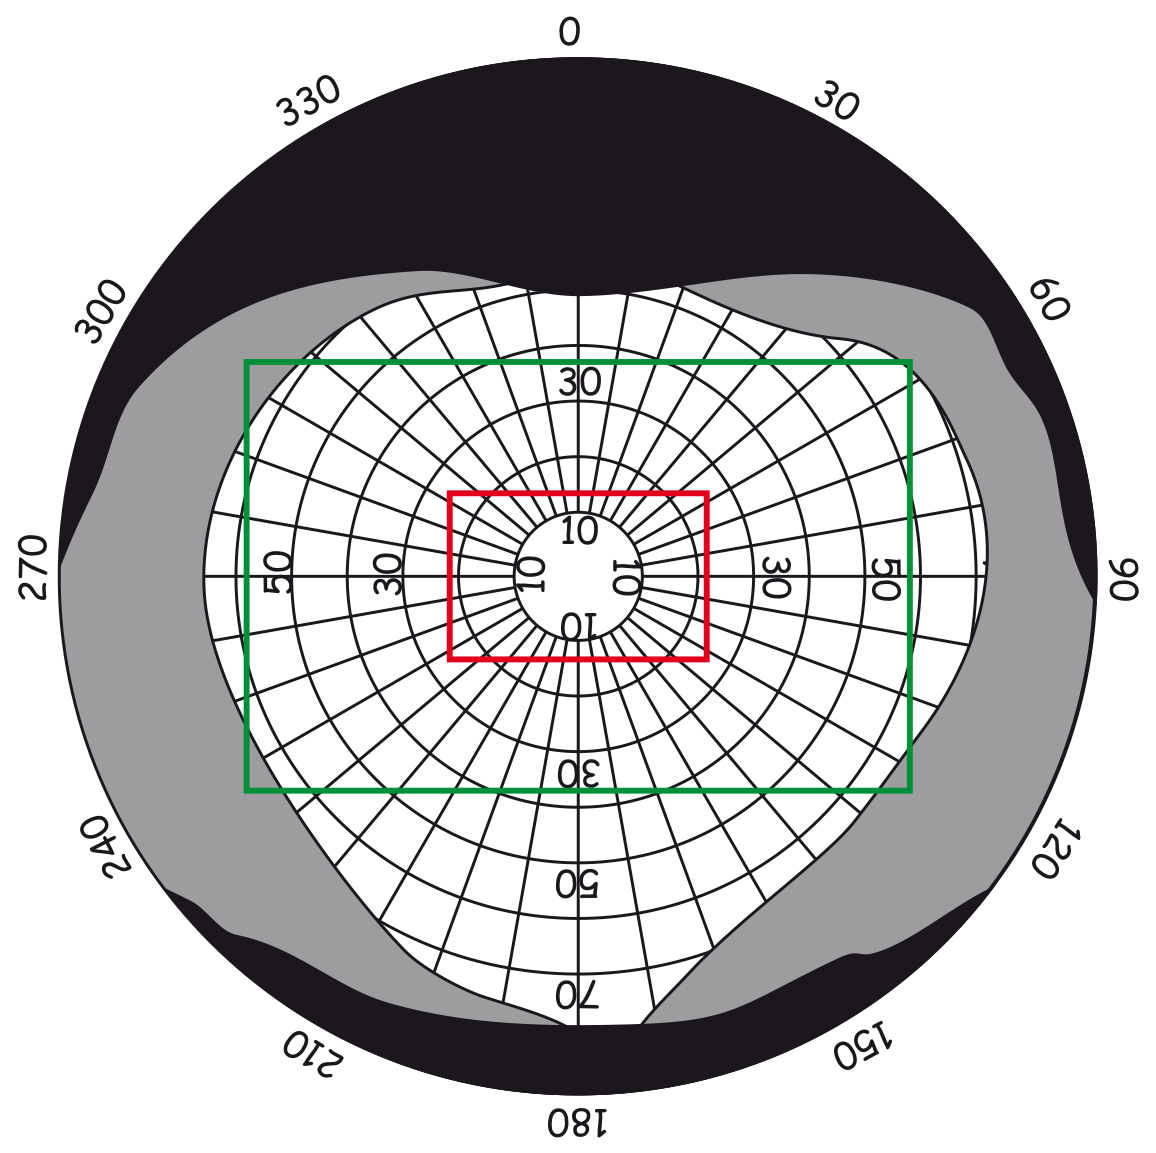
To summarise, the scope of the field of vision of the eyes is considerable, but in reality — as we are about to find out — it does not translate into seeing scenes equally clearly in each point of this field. To the contrary, only a small area located in the vicinity of the fovea of the retina provides the cortex of the brain with the data on the objects seen. The remaining (peripheral) part of the field of vision merely makes it possible to be aware of the presence of slightly blurred objects in visual scenes, but, instead, it is particularly sensitive to movement.
The scope of the field of vision and the size of an object in the visual scene frame
The scope of the field of vision tells us something about the shape and the size — expressed in angular units — of the framed visual scene, on which we focus or vision for a fraction of a second. Using the description of the field of vision with angular units it is worth stopping, and playing with simple arithmetic. It will allow us to realize in what way the brain estimates the distance and the size of objects seen in a scene. Three parameters decide about this information: (1) the size (S) of the viewed object (understood as its height or width), expressed in millimetres, centimetres or metres, (2) the angle (A) of the field of vision, expressed in degrees, and (3) the distance (D) of the object from the retina of the eye, expressed in millimetres, centimetres or metres (Fig. 42). As the size of the retina in the eye is constant, and the lens automatically adjusts the focal to the object located at the intersection of the visual axis, these two indices can be omitted while establishing particular parameters of objects located in the frame of a visual scene.
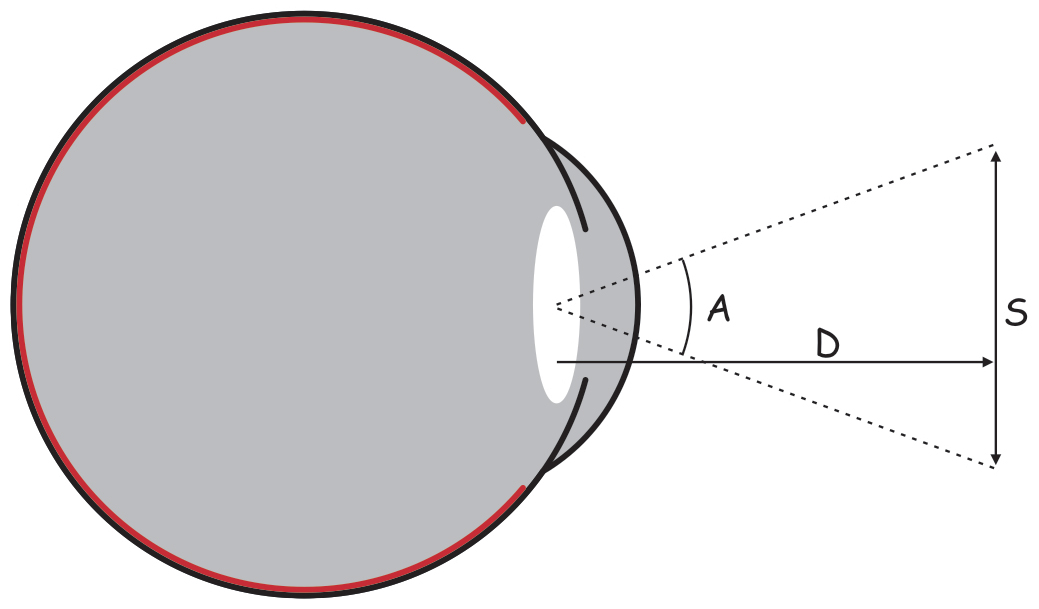
Knowing the real size of the object in metric units and its distance from the eyes of the observer, one can easily determine its angular size according to the following pattern:
If we know the angular size of the object and its distance from the eyes of the observer, we can, in turn, calculate its actual size:
We can also calculated in what distance from the eyes of the observer the object is located, knowing its actual and angular size:
We will apply these formulas in relation to the situation of looking at, for example, a painting at the museum. Let us assume that someone is looking at the painting sized 61 cm (in height) x 43 cm (in width) from the distance of 200 cm. On the basis of the formulas we can calculate that its angular height and width are equal to, respectively:

and

On the basis of the perimetric examination it is known that the average scope of the human field of vision in the vertical plane is approx. 130°, which means that the entire image with angular height of a little over 17° is located within the field of vision of the observer. Alas, it does not mean that it is seen equally clearly in all its entirety.
As it was signalized before, due to the structure of the retina, the human eye can clearly record at most only up to approx. 5° of the surface of the visual scene, and it turns out that from the distance of approximately 200cm it penetrates the surface of a painting up to approx. 17.5 cm (for 5° angle of the field of vision):
If we substitute the calculated diameter into the formula for the area of a circle, namely:

where π is constant and equals approx. 3.14 and r is the radius of the circle, namely half of its diameter, it will turn out that from the distance of 2 meters, we can see the surface of approx. 240 cm2 clearly.

At the first glance, it seems like a lot, but when we compare this area to the area of the entire painting, which is over 2,600 cm2,

where h is the height and w is the width, then it will turn out that the field of vision of approx. 240 cm2 covers less than 10% of the entire surface of the painting. It results from the following relation:
namely

It should be added that the brain “uses” the provided formulas for a variety of purposes, for example to assess the in-depth distance between two people. If it “knows” that they are of similar height (i.e. 180cm), but the angular size of one of them is, for example, 21°, and the other — 12°, one can easily conclude that the first one is located less than 5m away from the eyes of the observer:
and the other — more than 8.5 m from them:
We will return to the issues related to the result of the perimetric examination and the formulas, using which we may calculated the scope of the field of vision or the distance of an object from the observer, while discussing the issues concerning seeing shapes.
Vision – holistic or sequential?
Up until now I have been writing about seeing an image in such a way as if it was presented to us in its whole, with a single glance of the eye. Such is our subjective experience. Usually, we need a while to figure out what objects are present in a visual scene and what it means. We have an impression that we “grasp” images momentarily. But it is the subjective experience of seeing that obscures the truth regarding the sequential nature and lack of data which constitute its basis. Seeing is a process carried out in time and due to the fact that it is very short, among other things, we have the impression that images appear in front of our eyes all at once.
By the way, the momentary nature of the overall view of the image is also related to one of the most mysterious mental phenomena, namely the imagination. It is used to, among other things, recall scenes that were seen before under the influence of momentary stimulation of photoreceptors. It is a mechanism of operating the sources of visual memory. Sometimes one glimpse is truly enough to stimulate the imagination to reconstruct an entire visual scene and experience it as seeing (Francuz, 2007a; 2007b; 2010a; 2010b). Imagination also plays a substantial role in the processes of perceptive categorisation, which underlies the forming of the notions (Barsalou, 1999; Francuz, 2011).
Thus, the experience of seeing consists of two cooperating mechanisms. We have more or less learned about one of them. It is the mechanism of the visual scene content analysis, presented in the previous chapter. It is responsible for recording the distribution of light reflected from objects in the scene, or emitted by them, and forwarding these data to the cerebral cortex. It is the bottom-up mechanism of seeing. The second mechanism consists in the data concerning the look of the world, which were earlier recorded in various brain structures. The visual memory, which suggest all possible interpretations for the data currently reaching the brain via the bottom-up way. We must, however, remember, that we know significantly less about these top-down mechanisms than about the bottom-up ones.
I think that we are only at the very beginning of the road which will lead us the answering the question regarding the way in which data are stored in the visual memory, and how they are used to build the experience of seeing. Anyway, given the current level of knowledge on the visual perception we can only say that what we subjectively experience as seeing particular images (scenes or objects) is more of figment of the observer’s imagination, than recording the available reality using our eyes. I have already drawn attention to this several times, and I will keep on emphasising it. The seen scene is the effect of combining two types of data. One of them originate from the registration of the lighting distribution of its parts limited by the field of vision and the other ones, recorded in the visual memories that fill in the missing parts of the puzzle by means of an imaginary mechanism. Visual programs work so fast that we do not notice the subsequent phases of image — puzzle formation, but we have an impression that we immediately see it as a whole. It is similar with watching a film at the cinema. We can see smooth movement on the screen although, in fact, we only see 24 still photos every second. The factor determining the effect is a very short exposure time.
Why do our eyes move?
The movement of eyeballs is an observable sign of the sequential nature of seeing. To understand well what role it plays while watching a visual scene, we must first answer two fundamental questions: why do the eyes move at all and how do they move?
The scope of high-resolution field of vision with the use of receptors concentrated in the central part of the retina of the eye is not great. Let us recall that it covers at most 5° of the angle of the field of vision, which corresponds to approx. 3% of the surface of a 21-inch screen watched from the distance of 60 cm. Compared to the entire surface of the screen it really is not much. In order to see what is in the other, 3% parts of the surface, we simply have to point our eyes at them, changing the position of our eyes.
If the eyes were motionless, we would be forced to constantly move our head, which would consume disproportionately more energy than moving our eyes. Therefore, it would maladaptive, and the evolution normally does not reinforce such behaviours. To summarise, we move out eyes because, among other things, the scope of our field of vision is limited, and by changing their position we are able to see particular elements of a given scene and use them to put together the entire image. The sense of the previous sentence has very far-reaching consequences regarding understanding how we accumulate data concerning observed scenes.
Scanning different fragments of a visual scene is not the only reason for eye movement. The other one could be, for example, following a moving object without changing the position of the head or fixing the vision on a still object, while the observer is moving. To put it shortly, there are many types of eye movements and all of them have strictly defined functions in the process of optical framing of a visual scene. However, before I will describe different types of eye movements, it is worth taking a closer look at neuromechanics of the eyes.
Neuromechanics of the moving eye
The eye is embedded in the orbital cavity lined with a layer of the adipose tissue with a thickness of a few millimetres. Since major part of the outer layer of the eyeball, i.e. the sclera, is smooth, hence, the eye can move without any resistance in the orbital cavity, like a ball in a well-lubricated bearing. The eyeball is obviously smaller than the orbital opening and could easily fall out if it was not for the muscles holding it from the internal side of the skull. However, their role is not only to prevent the eye from falling out of the orbital cavity, but they perform much more important functions. The muscles attached to the eyeball constitute the mechanical basis for changing its position, such as muscles attached to the bones of an arm or a leg enable their movement.
Three pairs of antagonistic muscles attached to each posterior, external surface of each eye participate in each eye movement. The lateral rectus, the temporal rectus and the medial rectus enable the eye to move left or right; the rectus muscles, including the superior rectus and the inferior rectus move the eye up or down, whereas the oblique muscles, including the superior oblique and the inferior oblique, enable the eyeball to rotate, thanks to which it is possible to direct the eyes to places lying between the horizontal and vertical planes, e.g. to the upper right or lower left corner of the image (Fig. 43). It is worth mentioning that the eyes can also move backwards deeply into the skull. They perform the so-called retraction movement, which is the result of simultaneous contraction of all muscles, e.g. in the event of anticipated impact in the face. The muscles that move the eyeball are characterised by the fact that they contract in the fastest way among all the muscles that move the human body (Matthews, 2000).
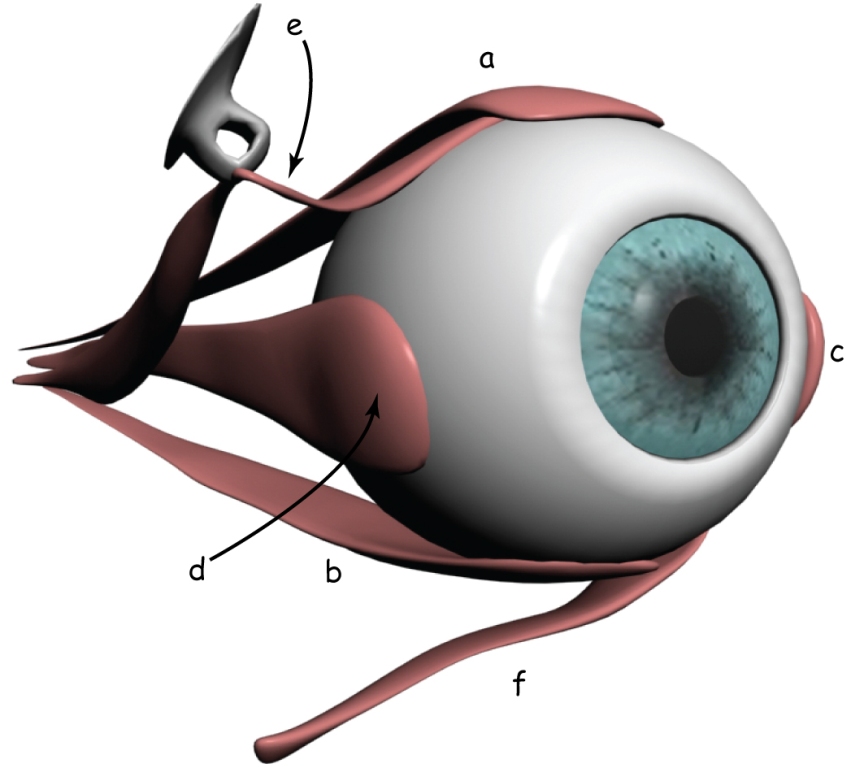
Due to the anatomical structure of the eye and skull, the way of placing the eyeball in the orbital cavity, and the characteristics of the listed pairs of extraocular muscles, the range of eye movements is limited to approx. 90° (maximum up to 100°) in the horizontal plane and approx. 80° (maximum up to 125°) in the vertical plane.
It is worth paying attention to the fact that although the range of eye movements in the orbital cavities is quite large, in practice, it generally does not exceed 30° in any plane. This is due to the head mobility. Looking, e.g. upwards, we rarely tighten the inferior rectus to the limits of strength, but rather we tilt the head slightly backwards and thus effortlessly focus our eyes on the object of interest, while keeping the eyes in a more natural position in the orbital cavity. However, if we would like to look, e.g. to the left side without moving the head, then the visual axis of the right eye will cross the nose and the image from that eye will be limited. Therefore, it is better to help yourself by turning your head to the left slightly.And finally, a few sentences concerning the connections between the extraocular muscles and the nearest brain structures, from which signals affecting their work come from. Pairs of muscles attached to the eyeballs react with a sudden contraction or relaxation under the influence of nerve impulses flowing along the cranial nerves from neurons (so-called motoneurons) located in the spinal cord. The rectus muscles (excluding the lateral temporal rectus) and the inferior oblique are activated by impulses flowing along the cell axons located in the accessory oculomotor nucleus (Edinger – Westphal nucleus), via the third cranial nerve (CN III), called the oculomotor nerve (Fig. 44). The superior oblique is controlled by the trochlear nerve nucleus (fourth cranial nerve nucleus) via the IV (trochlear) cranial nerve, whereas the rectus muscle is connected to the nucleus of the abducens nucleus via the VI (abducens) cranial nerve. For now, let us find out where the signals activating the extraocular muscles come from, but we will soon find out where the signals stimulating all three of these neural nuclei come from. It is their activation that translates into a specific movement of the eyeball.
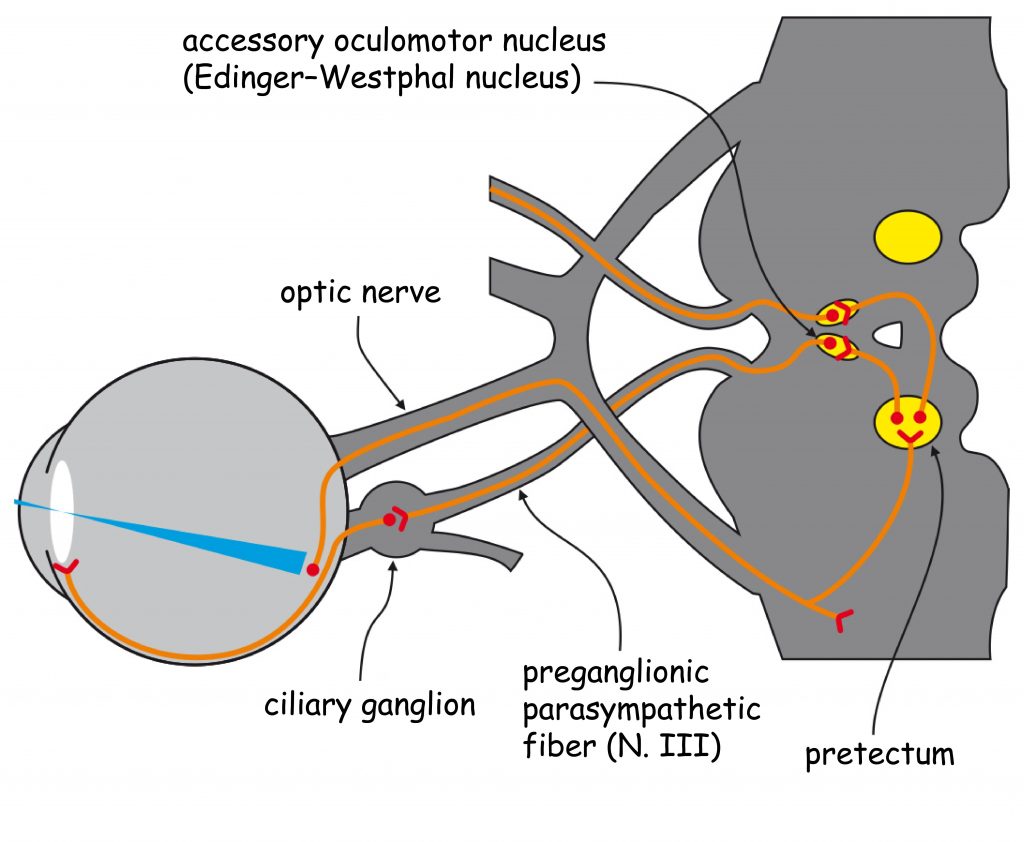
General eye movement classification
We have been already familiarised with the general concept of the eye movement. It is time to take a closer look at the different types of eye movements, both in terms of their functionality and the neurobiological mechanisms governing them. The typology of eye movements is quite broad, although some are more important and others slightly less important from the point of view of the issues discussed in this book. I will discuss them, starting with those of less significance for image viewing, and ending with those that constitute the core of the visual scene’s framing mechanism. In fact, the overriding goal of all types of eye movements is to maintain the highest quality of vision with varying conditions in regards of watching visual scene.
In the first group, eye movement is associated with the apparent immobility of the eyeball, i.e. the moment when the eye fixates for a moment on some fragment of the image. It is surprising, but even then the eyes perform at least three tiny and quite different micromovements in terms of trajectory, i.e. fixation movements: microsaccade, ocular drift and ocular mictrotremor. In short, they prevent the adaptation of photoreceptors to the same lighting during visual fixation.
In the second group, eye movements are reflexes, i.e. involuntary movements, the purpose of which is to take a longer look at a selected object in the visual scene, in specific viewing conditions. For instance, the purpose of the vestibulo-ocular reflex (VOR) is to take a longer look at a given object when the head is moving. Such situation occurs so often on a daily basis that a fully automated oculomotor mechanism has developed in the course of evolution. It enables us to hold gaze on the object of our interest when changing position towards it.
Another fully automated eye movement is the optokinetic reflex (OKR). Its purpose is to hold a gaze on an object when either it moves very quickly towards a stationary observer or the observer moves very quickly towards a stationary object. Finally, the third oculomotor reflex enables the observer to hold his/her gaze on an approaching or receding object or when the observer approaches to it or recedes from the object. These are so-called vergence reflexes. The ones that accompany the decreasing distance between the object and the observer are called convergence reflexes, whereas those that accompany the increasing distance are called divergence reflexes.
The third group of eye movements is especially important for understanding what vision is. These are framing movements. The first of them is called the saccade or intermittent eye movement and its goal is to precisely position the visual axis for both eyeballs on the most important, for some reason, fragment of the visual scene. Saccades, as we will see late, can be performed under the influence of impulses having their source in the visual scene, i.e. controlled bottom up or bottom-down, to a greater or lesser extent in accordance with the will of the observer. The second movement in this group is the so-called smooth pursuit. To understand its essence, it is enough to pay attention to how men (well, maybe not everyone) watch an attractive girl passing by. Their eyes are almost glued to any part of her body. The eyes move at exactly the same speed as she moves. This is the smooth pursuit.
Unlike all others types of movements, the common feature of the saccades and the smooth pursuit is that they are much more voluntarily controlled. Their goal is to frame the visual scene in such a way as to obtain as much data as possible from it, which will enable the construction of an accurate, cognitive representation of this scene.
Fixational eye movements
Each saccade ends with a short-term fixation, i.e. the eye movement stops on such a fragment of the visual scene where it is currently located in the line of sight. The fixated eye seems to be completely motionless, but it actually performs three types of involuntary fixation movements: ocular microtremor (OMT), ocular drift and microsaccade.
Fixational eye movements are fast and short, have a complicated, and seemingly chaotic, trajectory. However, they perform very important functions during vision. First of all, they prevent the adaptation of the already activated group of photoreceptors to the light acting on them. Slightly changing the stabilised eye position during fixation, these movements cause that new (but not yet activated) photoreceptors are constantly engaged in the recording of the same image projected on the retina. These movements also enable the collection of even more data from the cropped fragment of the visual scene, on which the eyes are fixated (Leigh and Zee, 2006; Martinez-Conde, Macknik and Hubel, 2004). All three types of movements were recorded for the first time and their detailed description was published by Roy M. Pritchard in 1961 (Fig. 45).
Ocular microtremor, also called tremor of the eyes or physiological nystagmus, is constant and completely involuntary eyeball activity during fixation. Among all micromovements, they have the lowest amplitude with a length not exceeding the diameter of a single cone located in the fovea (Martinez-Conde, Macknik, Troncoso and Hubel, 2009) as well as an incomparably higher frequency compared to them, within 70–100 Hz (Bloger, Bojanic, Sheahan, Coakley et al., 1999). The trajectory of ocular mictrotremor is different in each eye.
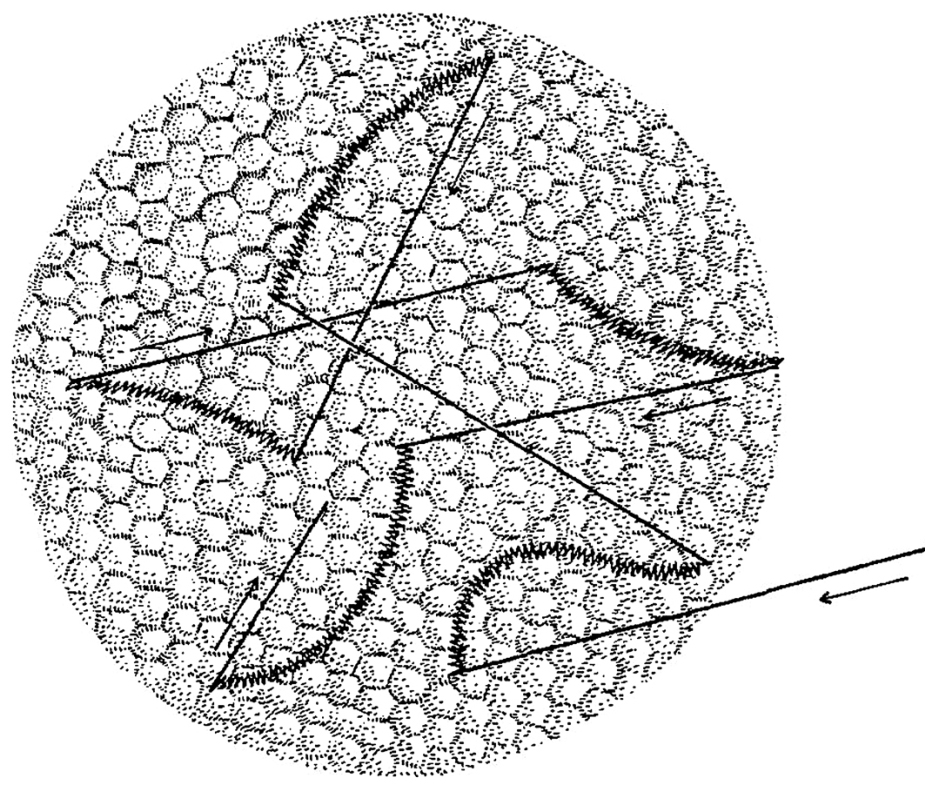
The other type of fixation movement is the microdrift. It is a relatively slow movement of the eyeball, in a rather random direction, because of which the image projected onto the retina constantly illuminates slightly other group of photoreceptors. The amplitude of the drift oscillates from 1′ to 8′ (angular minutes, namely 60 parts of the angular degree) and the speed is below 30′/s (Rolfs, 2009). Unlike ocular microtremor, the ocular drift causes a global shift in the relation between the image projected onto the retina and the photoreceptors in it. This movement prevents adaptation of photoreceptors to the same intensity of light, thus, it prevents the image from fading out. The image can fade out because photoreceptors which have already been stimulated for a moment stop absorbing new batches of light and are not sensitive to them. The already mentioned Roy M. Pritchard (1961) proved that stabilising an image on the same photoreceptor group results in seeing the image less and less clearly, until it fades out entirely. Much like in relation to ocular microtremor, during eye fixation on the same fragment of a visual scene, the trajectory of the ocular drift in the right and left eye is completely different (Fig. 46).
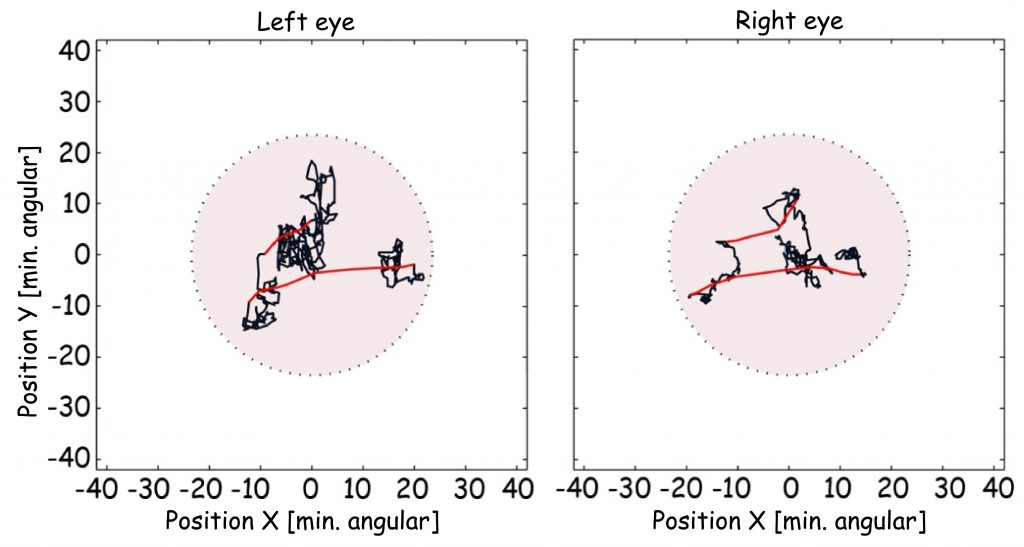
Finally, the third type of eye fixation movements are the microsaccades. They have been a subject of growing interest in the recent years. Engbert, 2006; Engbert, Kliegl, 2004; Martinez-Conde et al., 2004; 2009; Rolfs, 2009). They amplitude is very diversified, and oscillates between 3′ (angular minutes) to 2° of the field of vision angle, and its speed is usually incomparably higher than the speed of the ocular microtremor or ocular drift (Martinez-Conde et al., 2009). The effect of the shift of the retina in relation to the image projected onto it, caused by the microsaccade, is analogous to the microdrift. Microsaccade is, however, faster and most often it shifts the visual axis to a larger distance than the microdrift. Unlike the microtremors and microdrifts, microsaccades are performed synchronically by both eyes (see: red line in Fig. 46).
Martin Rolfs (2009) indicates many various functions performed by the microsaccades. First and foremost, they radically change the relation of the image projected onto the retina surface, preventing it from fading out; they moreover facilitate maintaining high clarity of vision, and are used to scan a small surface of fixation (among other things in order to detect the edges of objects in a visual scene more accurately), and play an important role in the process of programming next saccades, by means of shifting the so-called visual attention to new areas of a visual scene.
Oculomotor reflexes
I shall begin the overview of the movements of eyes engaged in the movement of either the observer or the objects in a visual scene by discussing three types of reflexes, namely such reactions of the eyes, which are almost entirely uncontrolled by the observer. These are: vestibulo-ocular reflex (VOR), optokinetic reflex, as well as vergence reflexes, convergence reflexes and divergence reflexes.
At first glance one can see that the head and the eyes can move independently of one other. It has its obvious advantages, because thanks to it the visual system is much better adapted to various life situations which require good orientation in space. This situation also breeds a certain problem, with which the evolution has dealt excellently. The problem consists in the fact that we often want to fix our vision on a certain detail of a visual scene, but were are, at the same time, moving. It is enough to imagine how complicated work has to be performed by the eye muscles in order to fix the vision in one, selected spot of a visual scene observed by a rider during horse riding competition. The head not only moves in all directions, balancing the disturbances related to the movement of the horse, but, moreover, keeps on changing its position in relation to the watched scene. A little less extreme, yet analogous, situation is looking at storefronts during a walk, or looking at paintings on the walls of a museum while moving.
The physiological mechanism which lies at the bottom of the VOR reflex, is the mechanism which uses data from the kinaesthetic system, first and foremost responsible for maintaining the balance of the body, in order to facilitate the function of the visual system (Fig. 48). The visual mechanism which prevents loss of clarity related to head movements is the vestibulo-ocular reflex. The reflex can be easily observed when we are constantly looking at a certain object, while moving our heads to the left and right (Fig. 47). Vestibulo-ocular reflex can be observed while performing a simple task. While looking into the mirror, let us try to fix the vision on our pupils and, simultaneously, move our head in all directions. Each movement in one direction will cause involuntary reaction of the eyes in the opposite. The speed of the head and eye movement is the same.
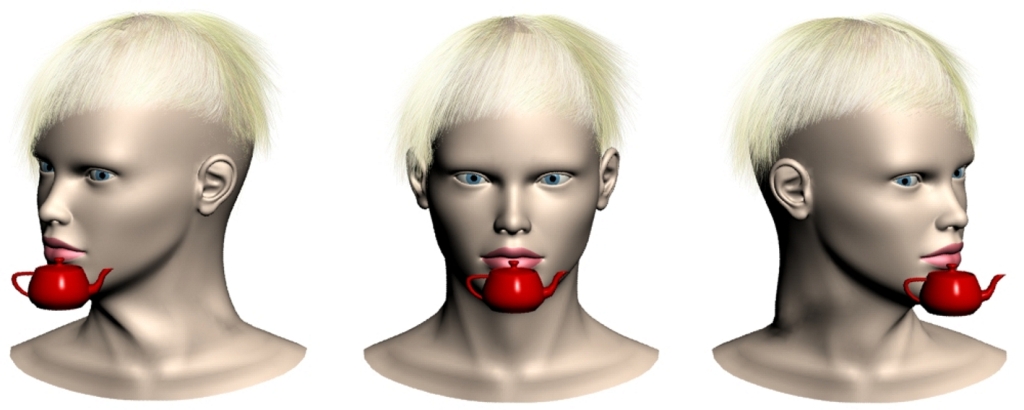
The physiological mechanism which lies at the bottom of the VOR reflex, is the mechanism which uses data from the kinaesthetic system, first and foremost responsible for maintaining the balance of the body, in order to facilitate the function of the visual system (Fig. 48).
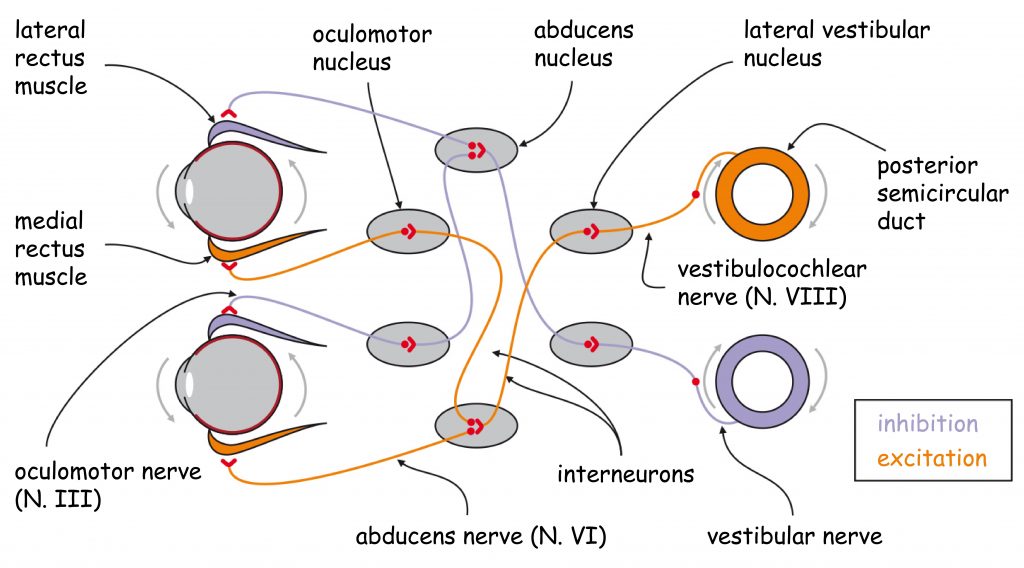
Detection of the location and movement of the head takes place in the vestibular organ, located in the inner ear. The data from the vestibular organ are forwarded to the lateral vestibular nuclei, small clusters of neurons located on both sides of the brainstem (more precisely in the lateral dorsal part of the medulla oblongata). From there, the signals are forwarded to two pairs of nuclei which are in direct charge of eye movement — the already-mentioned nuclei of the oculomotor and abducens nerve (Matthews, 2000; Nolte, 2011).
In summary, even the slightest tilt of the head from the vertical position is recorded in the vestibular organ and the information about it is diligently used by the system in charge of eyeball movement. Thanks to the vestibular ocular reflex we are able to constantly project a selected fragment of an image onto the central part of the retina without losing its clarity.
The optokinetic reflex occurs when the head is relatively stable, and the eyes are unwittingly fixing on a relatively large object, the image of which swiftly changes its location on the retina. For example, when we are on a train we from time to time fix out eyes on some element of the dynamic scene and when it disappears from the field of vision the eyes “attach” to another object. The optokinetic reflex can co-occur with the vestibular ocular reflex, i.e. when the head is additionally moving (Mustari and Ono, 2009). It is characterised by short latency time (below 100 ms), relatively high speed (even above 180°/sec.) and it is really difficult to control it (Büttner and Kremmyda, 2007). It basically is not very significant while viewing still images.
The basic function of both reflexes (the vestibular and the optokinetic reflex) is compensating for the loss of sharpness of the object located in a visual scene, caused either by the movement of the observer or the object, located in a plane perpendicular to the visual axis. On the other hand, the so-called vergence reflex occurs while looking at a visual scene in which the objects (or the observer) change their location in relation to one another in a line parallel to the visual axis, namely they either come closer or move away from one another.
Vergence occur in two forms, as convergence, i.e. convergent or divergence, i.e. divergent. Their speed is similar, approx. 25°/s. Vergence reflexes are responsible for maintaining the visual axis on an object, depending on the distance of the object from the observer. When the distance between them decreases, the pupils of the eyeballs approach each other (convergence), and when the speed is higher they stave off (divergence) (Fig. 49).
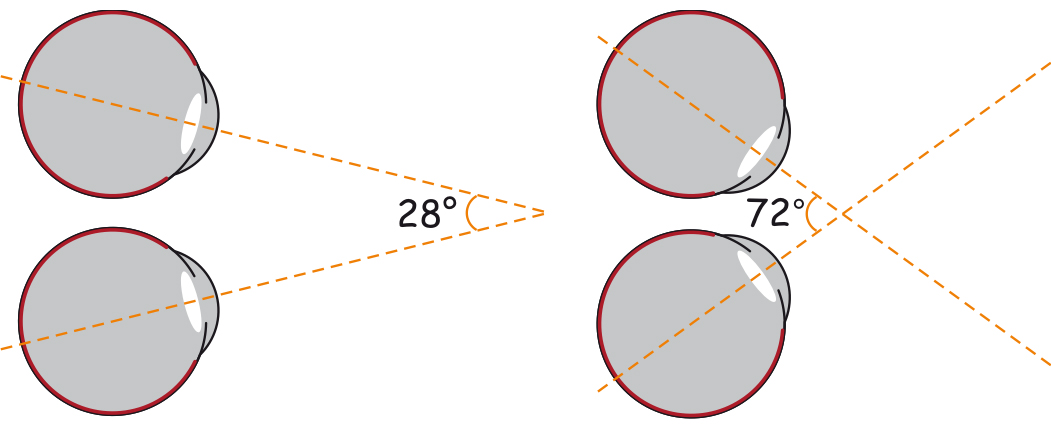
The reflex somewhat resembles making a squint, either convergent or divergent. When an object is located further than 5 — 6 meters away from the observer, the visual axes of both eyes are positions almost in parallel to each other. It is a limit above which vergence reflexes of the eyes play lesser and lesser role in stereoscopic, that is binocular depth perception. Just like the previous one, the reflex is of relatively small significance for depth recognition while looking at a flat surface of an image.
Basic mechanism of visual scene framing
Saccadic movements of the eyes are generally used to move the gaze from one point of the relatively stable visual scene to another one. They can be easily observed by looking into the eyes of a person who is watching something. We will notice that the pupils of the observer’s eyeballs every now and then, simultaneously, change their position, placing the visual axes on subsequent elements of the image being viewed.
After each saccade, the eyes are motionless for a shorter or longer period. This moment is called visual fixation and is one of the most important activities in the process of seeing. This is when the data are recorded on the level of photoreceptor stimulation in the retina. A moment later they are transmitted to the brain as information about the currently seen fragment of the visual scene. This is the moment when the “frame is exposed”.
In Fig. 50 B, I marked the saccadic movements (yellow lines) and places of visual fixation (yellow points) recorded while viewing the portrait of Krystyna Potocka by Angelica Kauffmann (the Wilanów collection) (Fig. 50 A). Twenty-four examined people were looking at the image, displayed on a computer screen; I was recording their eyeball movement using the SMI HighSpeed 1250Hz oculograph. The results of the experiment will be discussed in the final chapter of the book, which is devoted to perception of beauty.
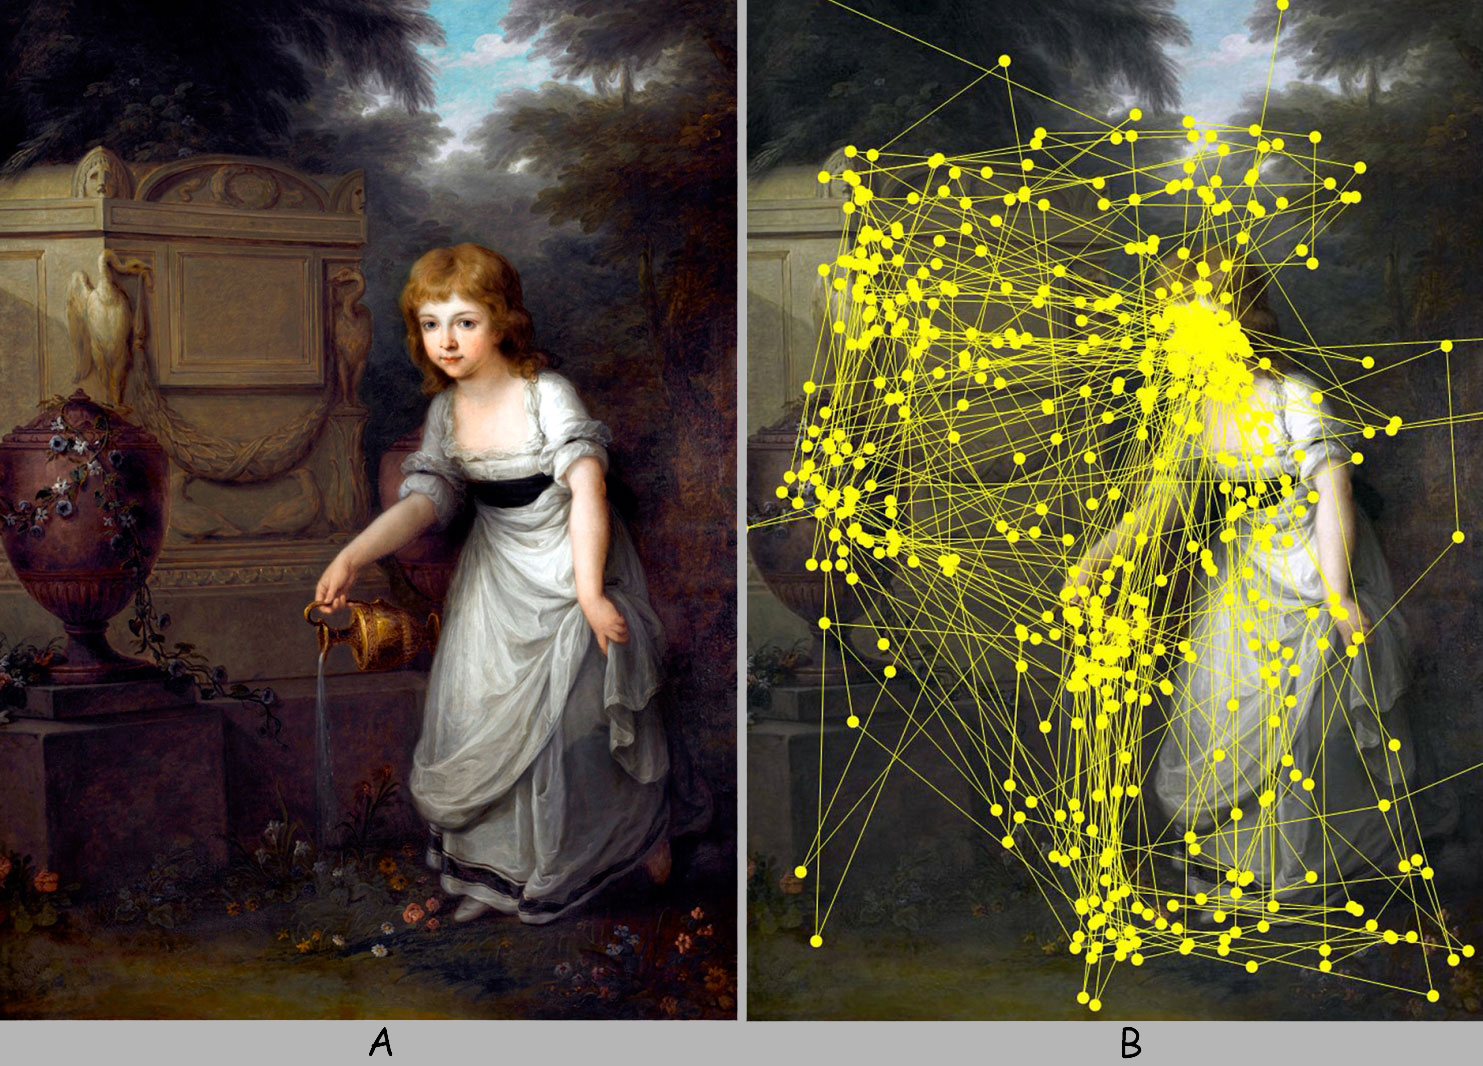
During saccades, photoreceptors are also stimulated. Nevertheless, taking into account the speed of eyeball movement, images projected on the eye’s retina at that time are wholly blurred — to the same extent as the image outside a speeding TGV can be blurred — both in the foreground — due to the movement of the train, and in the background – because of the distance (Fig. 50 C).
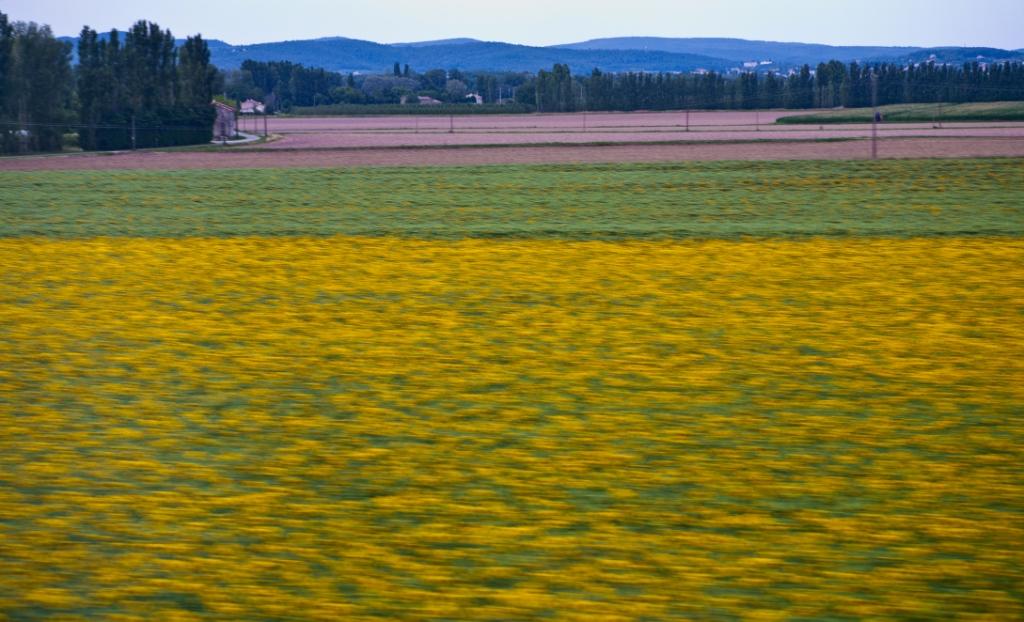
The brain ‘is not interested’ in these data and therefore temporarily turns off some components, to be more specific, those parts of the visual cortex which are responsible for receiving data on the status of photoreceptors stimulation (Paus, Marrett, Worsley and Evans, 1995; Burr, Morrone and Ross, 1994). This phenomenon is called saccadic suppression or saccadic masking. This mechanism is similar to the functioning of a shutter in a video camera (Fig. 51).
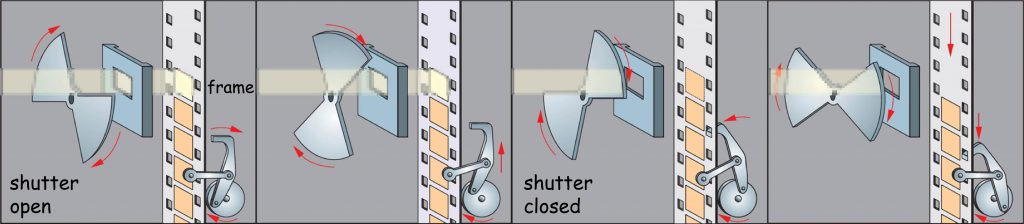
Recording a film involves exposure of a frame sequence on an immobilised celluloid film stock covered with a photosensitive photographic film. While the film stock is moved by one frame, the rotating shutter fully covers it for a moment. This way, the photographic film is not exposed during movement of the film stock only when it is motionless. Recording a visual scene with eyes is similar. The brain only analyses images that were recorded by photoreceptors during visual fixation, not during a saccade. Thanks to this, the visual scene (experienced by us as vision) is constructed primarily on the basis of sharp and still (i.e. non-blurred and motionless) images. Saccadic reaction times, like film stock shifting times, do not belong to the duration of the recorded visual scene. Fortunately, they are of a one order of magnitude shorter than fixations.
In each second, the eyes perform 3–5 saccades. However, there may be many more of them in moments of increased stimulation. Saccadic movements are rapid – they begin and end equally in a sudden way. Depending on the situation, they last from 10 to 200 ms. For instance, they constitute on average 30 ms while reading (Duchowski, 2007; Leigh and Zee 2006). They differ in length, i.e. amplitude, as well as in speed. The amplitude of a saccade depends on many factors, including the size of the visual scene or the location of objects within it, but generally does not exceed 15° angle of view (maximum can be up to 40°). Its duration is proportional to the amplitude, although it is not a straight-line relationship. Similarly, the saccadic speed increases proportionally (although not linearly) to the amplitude and it can be up to 900 °/sec in human. (Fischer and Ramsperger, 1984). This is the fastest movement of the human body. The relationships among the amplitude, time and speed of each saccade are relatively constant. This feature of saccadic movements is called saccade stereotypicality (Bahill, Clark and Stark, 1975).
The second feature of saccadic movements, next to the saccade stereotypicality, is saccade ballisticity (Duchowski, 2007). It is understood as the inertia as well as the stability of the eye-movement direction after the start of the saccade. Similarly as it is impossible to change the parameters of a stone’s flight from the moment of its throw, the saccade’s speed, acceleration and direction (programmed before its start) can, generally, no longer be changed while its duration (Carpenter, 1977).
There are many types of saccadic movements (for full classification see Leigh and Zee, 2006, pp. 109–110), but two of them are particularly important from the point of view of the issues presented in this book. These are reflexive saccades and voluntary saccades. Reflexive (or involuntary) saccades appear in response to specific elements of the visual scene, such as, for example, the sudden appearance of an object, rapid movement, saliency of its various elements, contrast, flashes or flickers, and even sounds towards which eyes are reflexively directed. Voluntary saccades are controlled top-down, i.e. their trajectory is subordinated to such factors as, e.g. knowledge, attitude, and conscious search for something in an image or the observer’s expectations.
Neuronal basis of saccadic movements
The most important neural structures that are involved in controlling eye movements (both saccadic and smooth pursuit ones) are shown in Fig. 52. Their multiplicity and complicated network of pathways connecting them make us well aware of how the complex mechanism controls the normal right or left glance. There is no place here for a coincidence, although sometimes this ‘machinery’ may not follow the course of events.
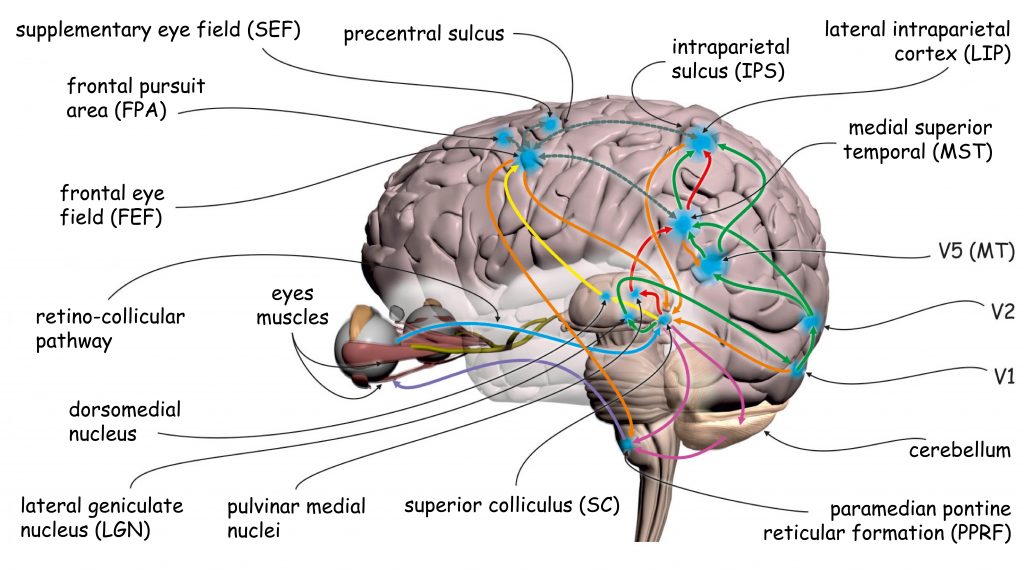
Let us start with those structures of the eye movement control system that constitute the early stages of the visual pathway. One of the most important structures is the superior colliculus (SC), located in the midbrain tectum. Nerve impulses reach the outer layers of this structure from the retina via the optic nerve fibre bundle, called the retino-collicular pathway (Fig. 52, blue tract).
The SC’s main task is to position the eyeballs so that their visual axes are directly opposite the most interesting part of the visual scene. The construction and functioning of this amazing structure is somewhat reminiscent of a modern sniper rifle sight. It is built in layers, as well as many subcortical structures (e.g. LGN) or cortical ones (e.g. V1) in brain (Fig. 53).
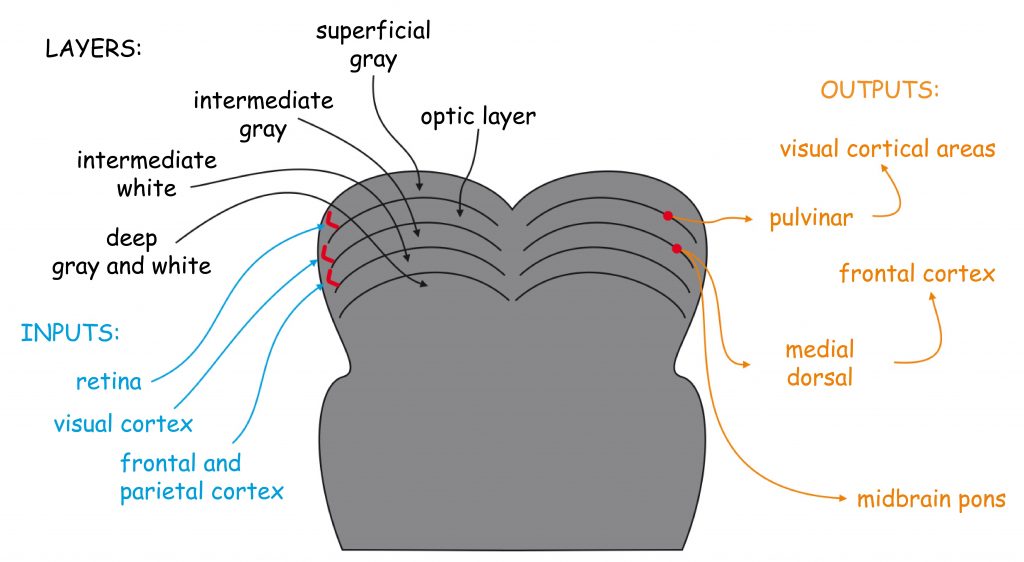
First of all, the SC top layer, which reaches synaptic endings of ganglion cells’ axons from the observer’s retinas (retino-collicular pathway), has a retinotopic organisation, analogous to the primary visual cortex (V1) (Nakahara, Morita, Wurtz and Optican, 2006).
There is a topographic relation between the reactions of photoreceptors located at specific retinal areas and the reactions of cells forming the SC top layer (see Fig. 54).
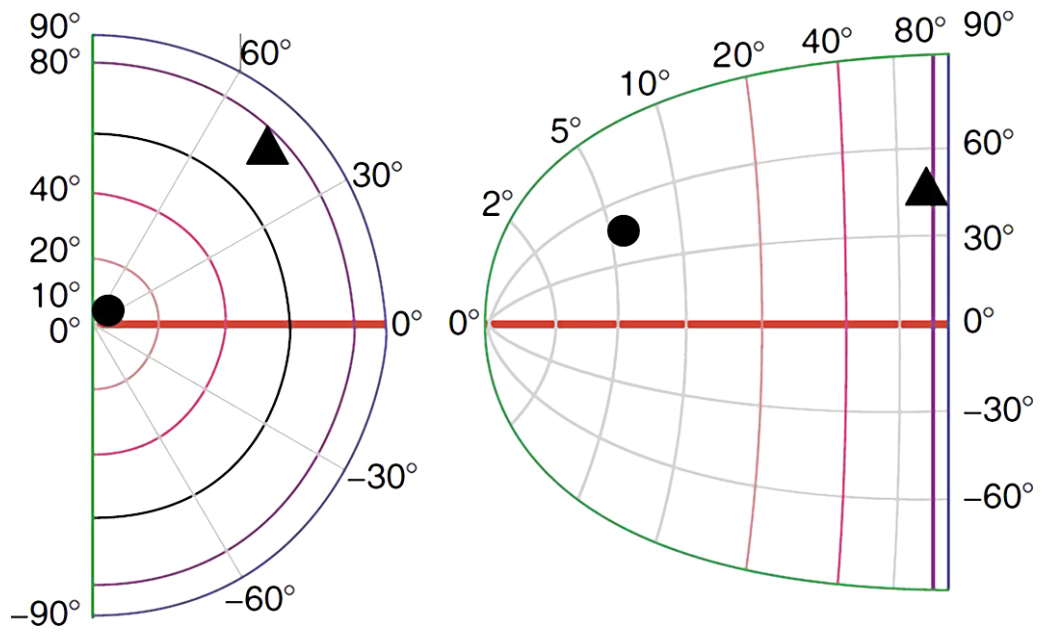
Just like in V1, also in SC the largest part of the map is occupied by a representation of the surroundings of fovea. This is perfectly illustrated by two figures (circle and triangle), marked on Fig. 54. The circle, the position of which it is difficult to determine on the basis of the retina chart, can be easily located on its retinotopic map in SC. The significance of topographically oriented retinal data in SC for the performance of the next saccade is similar to the significance of a map at military headquarters for precise determination of the target of the next attack.
Another extremely interesting feature of SC is the fact that cells located in its deeper layers react not only to visual, but also auditory (Jay and Sparks, 1984) and sensory stimuli (Groh and Sparks, 1996). It would explain, for example, why a sudden sound or smell can direct one’s eyes to its source. Collicular viewfinder is therefore not an organ isolated from the other senses, specialised only in the response to visual stimuli, but a biological device sensitive to a much wider spectrum of sensory stimulation. Thanks to such structures we feel that our senses do not work separately, but they constitute a fully integrated system reacting in a coordinated way to various manifestations of the reality (Cuppini, Ursino, Magosso, Rowland et al., 2010).
Finally, SC coordinates the work of several various brain structures, sending to them and receiving from them neural impulses in order to finally determine the location of the next saccade. After receiving the data on the current position of the eye in relation to a visual scene from the retina, SC sends them towards two structures located in the cerebral cortex (Fig. 52).
The first track, or rather several separate pathways, leads to parietal lobes, more precisely to the lateral intraparietal cortex (LIP), lining the surface of intraparietal sulcus (IPS). One of the pathways leads to this area via LGN, the primary visual cortex (V1) and further through the medial temporal (MT) area, i.e. the already mentioned V5 — area responsible for seeing movement and the medial superior temporal (MST) area, which are located deep down the superior temporal sulcus (Fig. 52, green tract).
The other pathway runs along a shorter track through the pulvinar media nuclei and from there directly to the superior temporal sulcus and further to the IPS (Wurtz, 2008) (Fig. 52, red tract).
The second important structure to which the SC sends data on the current position of the eye is in the frontal cortex, more precisely, in the posterior part of the middle frontal gyrus and in the adjacent precentral sulcus. This structure is known under the rather peculiar name of frontal eye field (FEF). In reality this centre is responsible for any saccadic movement of the eye on the opposite side of the head, and for a smooth motion of the eyeballs. The track from SC to FEF leads through the dorsomedial nucleus, located in the thalamus (Fig. 52, yellow tract).
After obtaining all the necessary data from the thalamic nuclei, pulvinar and structures located in the visual dorsal pathway (and especially MT and MST) both centres, that is IPS and FEF, perform: analysis of data concerning the current position of the eye in relation to the frame of the visual scene, reconciliation of the analysis results between one another and, subsequently, they send back the decision on the change of the eye position to SC (Gottlieb and Balan, 2010; Kable and Glimcher, 2009; Noudoost, Chang, Steinmetz and Moore, 2010; Wen, Yao, Liu and Ding, 2012) (fig. 52, orange tract). The coordinates of the new eye position are plotted on a retinal retinotopic map of the retina in the top layer of SC and passed on in the form of an instruction to be performed.
From SC, information travels to a small group of nuclei, located in the medial part of the paramedian pontine reticular formation (PPRF) by two pathways. One leads directly from SC to PPRF, and the second indirectly through the cerebellum, which participates in all operations related to the movement of the organism (Grossberg, Srihasam and Bullock, 2012) (Fig. 52, purple tract). Through the connections of PPRF with the nuclei of: oculomotor nerve, trochlear nerve and abducens nerve, the signal is finally sent to three extraocular muscle pairs, via the III, IV and VI cranial nerves (Fig. 52, violet tract). Muscles contract or relax, causing the eye to move, that is, the saccade, and thus establish a new position of the centre of the frame. This is how the operation of performing a single eye movement comes to an end, which in normal conditions usually takes no more than 1/3 of a second.
Smooth pursuit
Among the eye movements whose purpose is to keep a moving object in the frame in a plane perpendicular to the visual axis, the most important is the smooth pursuit. The justification for discussing it in the book devoted to the flat, still image is the fact that more and more often we see such images on the bodies of trams or buses, as well as on billboards pulled on trailers behind the car.
The average speed of the smooth pursuit is much lower than the speed of saccades and it usually does not exceed 30°/sec., except for its first phase. Smooth pursuit begins approx. 100 — 150 ms after object movement is detected (Büttner and Kremmyda, 2007). From that moment, for 40ms, the eye accelerates in the direction of object movement, trying to “catch up” with it. The speed of the eye can increase even to 50°/sec during that time and — depending on the speed of the object and the distance from which it is viewed — the visual axis can move ahead of the object or remain somewhat behind it. In any case, for the next 60ms the eye will roughly adjust its speed to the speed of the object. This is the first stage, called open-loop pursuit. Its aim is simply to initiate the movement of the eyeballs and shift the visual axis in the direction of the object movement and, if possible, align the object at their intersection. The course of this stage is almost identical in humans and monkeys (Carl and Gellman, 1987; Krauzlis and Lisberger, 1994).
The second stage of the smooth pursuit is to hold a gaze on a constantly moving object. It is based on a closed-loop pursuit. Several times a second, the visual system checks a size of the difference between the position of a moving object and the position of an eye, or more precisely – the fovea. Initially, the adjustment of both positions takes place 3–4 times per second and if the object moves more or less at a constant speed, it decreases to 2–3 times per second (Leigh and Zee, 2006). In this way, with the help of short saccades, the visual axes constantly intersect a moving object approximately in the same place. Since the saccades are small (and the further the object is from the observer, the shorter saccades are), the pursuit movement gives the impression that it is smooth rather than saccadic.
An interesting property of the smooth pursuit is its inertia. When the pursued object suddenly disappears from the field of vision (i.e. a car, which is being observed, disappears behind roadside trees), for approx. 4 seconds the eyes will continue smooth pursuit in the direction established before the disappearance of the object (despite its absence in the scene), and their speed will begin to slowly decrease, however, to no less than 60% of the initial speed. If 4 seconds after its disappearance the object does not reappear in the frame, smooth pursuit ends (Barnes, 2008; Becker and Fuchs, 1985).
The mechanism of smooth pursuit intertia estimates the most likely time and place of object’s emergence from behind the obstruction, in order to enable the eyes to maintain vision on it. Of course, this effect is conditioned by constant speed and known movement direction of the object, as well as the possibility to observe it for a certain amount of time before it disappears from the field of vision.
It is also worth adding that human visual system is much better at maintaining vision on moving objects, which move horizontally rather than vertically in a plane perpendicular to the visual axis, and if their movement is vertical, it is better when they are descending not ascending (Grasse and Lisberger, 1992). This order reflects the frequency with which we deal with a given type of movement in a visual scene. We most often see objects moving in a horizontal plane (to the right or to the left), more rarely — in a vertical plane, from the top to the bottom (for example falling objects), and even more rarely — in a vertical plane, from the bottom to the top.
Neurophysiological smooth pursuit model
Neurophysiological mechanism of smooth pursuit combines three oculomotor programs: vestibulo-ocular reflex, saccadic movement and specific smooth pursuit. The subcortical structures, especially in the brainstem, connect it to the vestibulo-ocular reflex (Cullen, 2009). Most often, when following a slowly moving object, we do not only let our eyes follow it, but we also move our head. The smooth pursuit, however, differs from the reflexive visual fixation on an object when moving the head, because it is primarily much more voluntary.
Similarly, both smooth pursuit and saccadic movement are controlled by many of the same structures, lying on the visual pathway, ranging from LGN, V1, MT, MST to FEF (Grossberg, Srihasam and Bullock, 2012; Ilg, 2009). Unlike saccade movement, smooth pursuit does not require the involvement of structures located in the superior colliculus (SC).
Finally, the third mechanism, which plays the most important role in the process of any initiation and maintenance of the smooth pursuit, involves specific cortical structures associated with the already known saccadic movements, the leading centre of the frontal eye field (FEF), such as the frontal pursuit area (FPA) and the supplementary eye field (SEF) (Fig. 52).